
Adapter Containers: The Universal Translators of Kubernetes
A DevOps Engineer's Guide to Data Transformation and Interface Standardization

What You'll Learn Today
Master the adapter pattern, understand how to standardize heterogeneous systems, and discover why this pattern is crucial for monitoring, logging, and data integration in complex microservices environments.
The Problem: Data Format Chaos
Your monitoring system expects metrics in Prometheus format, but your legacy application outputs custom JSON. Your log aggregator needs structured logs, but your third-party service produces unstructured text. Your API gateway requires specific headers, but your backend services use different conventions.
The adapter pattern solves this by transforming data formats, protocols, and interfaces without modifying the original applications.
What Are Adapter Containers?
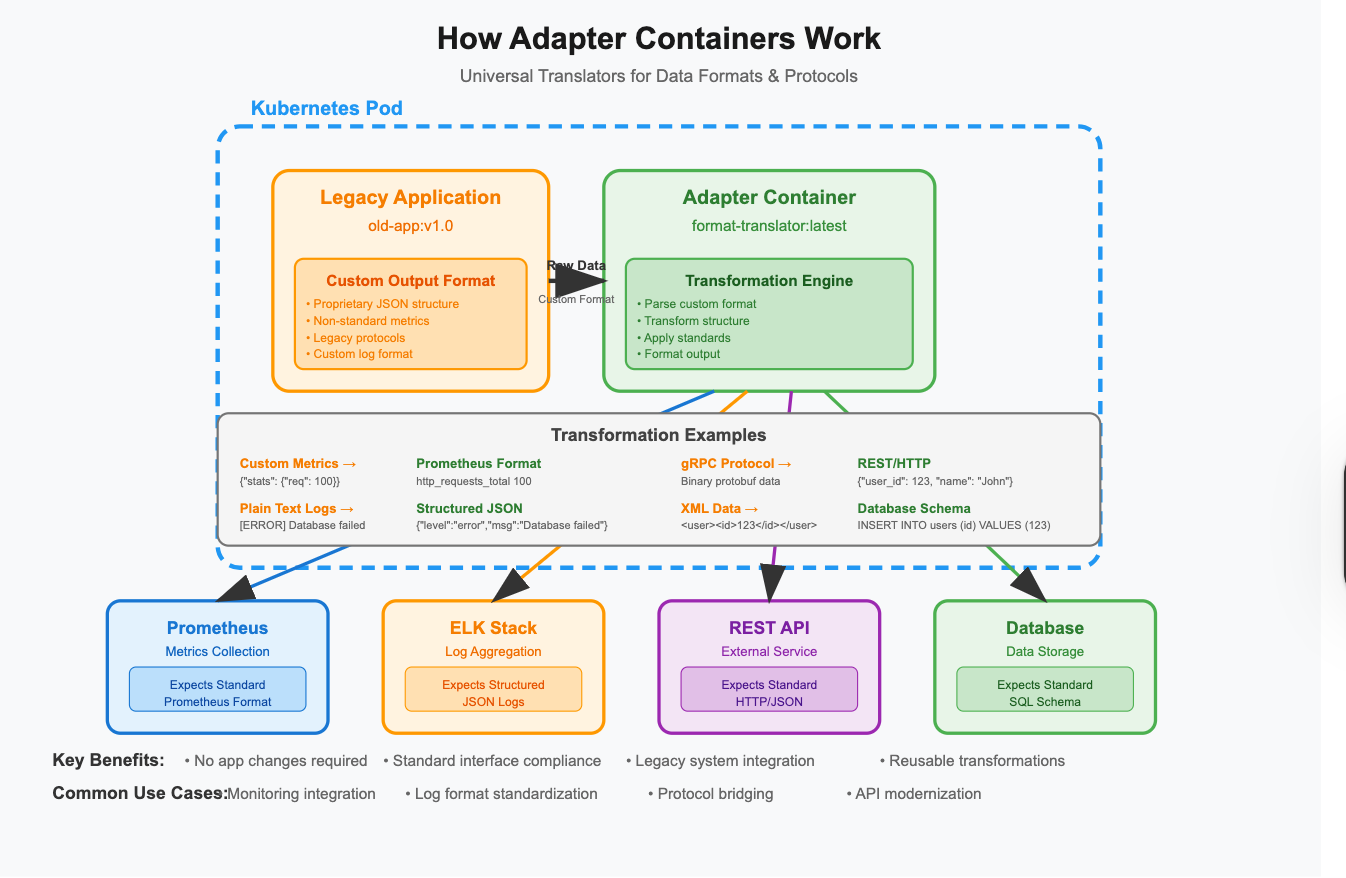
Adapter containers are specialized containers that transform data, protocols, or interfaces between your main application and external systems. They act as translators, converting one format or protocol to another while running alongside your application.
Key Characteristics:
Data transformation: Convert formats, protocols, and structures
Interface standardization: Present consistent APIs to external systems
Legacy integration: Connect old systems to modern infrastructure
Protocol bridging: Translate between different communication methods
Non-invasive: No changes required to existing applications
How Adapter Containers Work
The Transformation Flow:
External System    →    Adapter Container    →    Main Application
(Expected Format)       (Transformation)          (Native Format)

Prometheus         →    Metrics Adapter     →    Custom JSON API
ELK Stack         →    Log Adapter         →    Unstructured Logs
REST API          →    Protocol Adapter    →    gRPC Service
SQL Database      →    Data Adapter        →    NoSQL Application
Architecture Pattern:
Common Adapter Patterns
1. Metrics Adapter
Purpose: Convert custom metrics to standard monitoring formats Common Use: Legacy apps → Prometheus, StatsD → InfluxDB
containers:
- name: legacy-app
  image: old-application:v1.0
  ports:
  - containerPort: 8080

- name: metrics-adapter
  image: prometheus-json-exporter:latest
  ports:
  - containerPort: 7979
  command:
  - /bin/prometheus-json-exporter
  - --config.file=/config/config.yml
  volumeMounts:
  - name: adapter-config
    mountPath: /config
  env:
  - name: SOURCE_URL
    value: "http://localhost:8080/internal/stats"
2. Log Format Adapter
Purpose: Transform log formats for centralized logging Common Use: Custom logs → ELK, Proprietary → Fluentd
containers:
- name: application
  image: my-app:latest
  volumeMounts:
  - name: logs
    mountPath: /var/log/app

- name: log-adapter
  image: busybox
  command:
  - sh
  - -c
  - |
    while true; do
      tail -F /var/log/app/application.log | \
      sed 's/\[ERROR\]/{"level":"error","timestamp":"'$(date -Iseconds)'","message":"/g' | \
      sed 's/\[INFO\]/{"level":"info","timestamp":"'$(date -Iseconds)'","message":"/g' | \
      sed 's/$/"}/' > /var/log/structured/app.json
      sleep 1
    done
  volumeMounts:
  - name: logs
    mountPath: /var/log/app
    readOnly: true
  - name: structured-logs
    mountPath: /var/log/structured
3. Protocol Adapter
Purpose: Bridge different communication protocols Common Use: REST → gRPC, HTTP → Message Queue
containers:
- name: grpc-service
  image: my-grpc-service:latest
  ports:
  - containerPort: 9090

- name: rest-adapter
  image: grpc-gateway:latest
  ports:
  - containerPort: 8080
  command:
  - /usr/local/bin/grpc-gateway
  - --grpc-server-endpoint=localhost:9090
  - --logtostderr=true
  env:
  - name: GRPC_ENDPOINT
    value: "localhost:9090"
4. Data Format Adapter
Purpose: Transform data structures and schemas Common Use: XML → JSON, CSV → Database format
containers:
- name: xml-service
  image: legacy-xml-service:latest
  ports:
  - containerPort: 8080

- name: json-adapter
  image: xml-to-json-converter:latest
  ports:
  - containerPort: 8081
  env:
  - name: UPSTREAM_SERVICE
    value: "http://localhost:8080"
  - name: TRANSFORM_CONFIG
    value: "/config/transform.yaml"
  volumeMounts:
  - name: transform-config
    mountPath: /config
5. Database Adapter
Purpose: Translate between different database interfaces Common Use: SQL → NoSQL, Legacy DB → Modern API
containers:
- name: legacy-database
  image: old-database:v2.1
  ports:
  - containerPort: 5432

- name: rest-api-adapter
  image: postgrest/postgrest:latest
  ports:
  - containerPort: 3000
  env:
  - name: PGRST_DB_URI
    value: "postgres://user:pass@localhost:5432/db"
  - name: PGRST_DB_SCHEMA
    value: "public"
  - name: PGRST_DB_ANON_ROLE
    value: "web_anon"
Real-World Use Cases
Use Case 1: Legacy Monitoring Integration
Scenario: 10-year-old Java application with custom JMX metrics needs Prometheus monitoring
apiVersion: v1
kind: Pod
metadata:
  name: legacy-app-with-monitoring
spec:
  containers:
  - name: legacy-java-app
    image: company/legacy-app:v10.2
    ports:
    - containerPort: 8080  # App port
    - containerPort: 9999  # JMX port
    env:
    - name: JMX_OPTS
      value: "-Dcom.sun.management.jmxremote.port=9999 -Dcom.sun.management.jmxremote.authenticate=false"

  - name: jmx-prometheus-adapter
    image: sscaling/jmx-prometheus-exporter:latest
    ports:
    - containerPort: 5556
    command:
    - java
    - -jar
    - jmx_prometheus_httpserver.jar
    - "5556"
    - "/config/jmx-config.yaml"
    volumeMounts:
    - name: jmx-config
      mountPath: /config

  volumes:
  - name: jmx-config
    configMap:
      name: jmx-exporter-config
Use Case 2: Multi-Format Log Aggregation
Scenario: Microservices producing different log formats need centralized logging
apiVersion: v1
kind: Pod
metadata:
  name: multi-format-logging
spec:
  containers:
  - name: service-a
    image: service-a:latest
    # Outputs JSON logs
    volumeMounts:
    - name: logs-a
      mountPath: /var/log/service-a

  - name: service-b
    image: service-b:latest
    # Outputs plain text logs
    volumeMounts:
    - name: logs-b
      mountPath: /var/log/service-b

  - name: log-format-adapter
    image: log-adapter:latest
    command:
    - /bin/sh
    - -c
    - |
      # Transform service-b logs to JSON
      tail -F /logs-b/app.log | \
      jq -R '{timestamp: now, level: "info", service: "service-b", message: .}' > /unified-logs/service-b.json &

      # Copy service-a logs (already JSON)
      tail -F /logs-a/app.json > /unified-logs/service-a.json &

      wait
    volumeMounts:
    - name: logs-a
      mountPath: /logs-a
      readOnly: true
    - name: logs-b
      mountPath: /logs-b
      readOnly: true
    - name: unified-logs
      mountPath: /unified-logs

  - name: fluent-bit
    image: fluent/fluent-bit:latest
    volumeMounts:
    - name: unified-logs
      mountPath: /var/log/unified
      readOnly: true
Use Case 3: API Gateway Integration
Scenario: Internal gRPC services need REST API exposure for web clients
apiVersion: v1
kind: Pod
metadata:
  name: grpc-rest-gateway
spec:
  containers:
  - name: user-service
    image: grpc-user-service:v2.1
    ports:
    - containerPort: 9000

  - name: order-service
    image: grpc-order-service:v1.8
    ports:
    - containerPort: 9001

  - name: grpc-web-adapter
    image: grpc-web-proxy:latest
    ports:
    - containerPort: 8080
    command:
    - grpcwebproxy
    - --backend_addr=localhost:9000,localhost:9001
    - --run_tls_server=false
    - --allow_all_origins

  - name: rest-adapter
    image: envoy-grpc-gateway:latest
    ports:
    - containerPort: 8081
    volumeMounts:
    - name: envoy-config
      mountPath: /etc/envoy
Advanced Adapter Patterns
Multi-Stage Transformation
containers:
- name: data-source
  image: legacy-data-source:latest

- name: stage1-adapter
  image: xml-to-json:latest
  # XML → JSON

- name: stage2-adapter
  image: json-to-avro:latest
  # JSON → Avro

- name: stage3-adapter
  image: avro-to-kafka:latest
  # Avro → Kafka
Bidirectional Adapter
containers:
- name: internal-service
  image: my-service:latest

- name: protocol-adapter
  image: bidirectional-adapter:latest
  ports:
  - containerPort: 8080  # REST interface
  - containerPort: 9090  # gRPC interface
  env:
  - name: INTERNAL_SERVICE_URL
    value: "http://localhost:3000"
  - name: MODE
    value: "bidirectional"
Best Practices for Adapter Containers
1. Keep Transformations Simple
# ✅ Good: Single responsibility
- name: metrics-adapter
  image: prometheus-exporter:latest
  command: ["export-metrics", "--source=http://localhost:8080/stats"]

# ❌ Bad: Multiple transformations
- name: mega-adapter
  image: all-in-one-adapter:latest
  command: ["transform-everything"]
2. Handle Errors Gracefully
containers:
- name: resilient-adapter
  image: my-adapter:latest
  env:
  - name: RETRY_ATTEMPTS
    value: "3"
  - name: BACKOFF_STRATEGY
    value: "exponential"
  - name: FALLBACK_ENABLED
    value: "true"
  livenessProbe:
    httpGet:
      path: /health
      port: 8080
    failureThreshold: 3
    periodSeconds: 10
3. Performance Optimization
containers:
- name: high-perf-adapter
  image: streaming-adapter:latest
  resources:
    requests:
      memory: "256Mi"
      cpu: "200m"
    limits:
      memory: "512Mi"
      cpu: "500m"
  env:
  - name: BUFFER_SIZE
    value: "8192"
  - name: BATCH_SIZE
    value: "100"
  - name: FLUSH_INTERVAL
    value: "5s"
4. Configuration Management
containers:
- name: configurable-adapter
  image: flexible-adapter:latest
  volumeMounts:
  - name: transformation-rules
    mountPath: /config/rules
  - name: schema-definitions
    mountPath: /config/schemas
  env:
  - name: CONFIG_RELOAD_INTERVAL
    value: "30s"
Monitoring Adapter Containers
Key Metrics to Track:
Transformation Rate: Messages/records processed per second
Error Rate: Failed transformations vs successful ones
Latency: Time taken for data transformation
Queue Depth: Backlog of data waiting for transformation
Resource Usage: CPU/Memory consumption during processing
Monitoring Setup:
containers:
- name: adapter-with-metrics
  image: monitored-adapter:latest
  ports:
  - containerPort: 9090  # Metrics endpoint
  env:
  - name: METRICS_ENABLED
    value: "true"
  - name: METRICS_PATH
    value: "/metrics"

- name: metrics-collector
  image: prometheus:latest
  command:
  - prometheus
  - --config.file=/etc/prometheus/prometheus.yml
  - --storage.tsdb.path=/prometheus/
  volumeMounts:
  - name: prometheus-config
    mountPath: /etc/prometheus
Common Pitfalls and Solutions
Pitfall 1: Data Loss During Transformation
Problem: Adapter fails and loses data in transit Solution: Implement buffering and persistence
containers:
- name: reliable-adapter
  image: buffered-adapter:latest
  volumeMounts:
  - name: buffer-storage
    mountPath: /var/buffer
  env:
  - name: PERSISTENCE_ENABLED
    value: "true"
  - name: BUFFER_TYPE
    value: "disk"
Pitfall 2: Performance Bottlenecks
Problem: Adapter becomes the limiting factor Solution: Implement streaming and batching
containers:
- name: streaming-adapter
  image: high-throughput-adapter:latest
  env:
  - name: PROCESSING_MODE
    value: "streaming"
  - name: PARALLEL_WORKERS
    value: "4"
Pitfall 3: Schema Evolution Issues
Problem: Data format changes break the adapter Solution: Version-aware transformation
containers:
- name: schema-aware-adapter
  image: versioned-adapter:latest
  env:
  - name: SCHEMA_REGISTRY_URL
    value: "http://schema-registry:8081"
  - name: AUTO_SCHEMA_EVOLUTION
    value: "true"
Adapter vs Other Patterns
Adapter vs Sidecar:
Adapter: Focuses on data/protocol transformation
Sidecar: Adds functionality (logging, monitoring, security)
Adapter vs Init Container:
Adapter: Runs throughout application lifecycle
Init Container: Runs once before application starts
Adapter vs Service:
Adapter: Tightly coupled transformation within pod
Service: Loosely coupled, independent transformation service
Troubleshooting Guide
Transformation Failures:
# Check adapter logs
kubectl logs <pod-name> -c <adapter-container>

# Verify input data format
kubectl exec <pod-name> -c <main-app> -- curl localhost:8080/data

# Test transformation manually
kubectl exec <pod-name> -c <adapter> -- /test-transform.sh
Performance Issues:
# Monitor resource usage
kubectl top pods --containers

# Check transformation rate
kubectl exec <pod-name> -c <adapter> -- curl localhost:9090/metrics

# Analyze bottlenecks
kubectl exec <pod-name> -c <adapter> -- ps aux
Configuration Problems:
# Verify configuration
kubectl exec <pod-name> -c <adapter> -- cat /config/transform.yaml

# Test configuration reload
kubectl exec <pod-name> -c <adapter> -- kill -HUP 1
Action Items for This Week
Identify Integration Points: Find places where data format differences cause friction
Audit Legacy Systems: Document custom formats and protocols in your environment
Build Adapter Library: Create reusable adapter containers for common transformations
Implement Monitoring: Add metrics to existing adapter implementations
Plan Migrations: Use adapters to gradually modernize legacy integrations
Key Takeaways
Adapter containers enable integration without modifying existing applications
They transform data formats, protocols, and interfaces seamlessly
Essential for legacy system integration and standardization
Focus on single-responsibility and error handling
Monitor transformation performance and reliability
Use for gradual migration strategies
Next Week Preview
Next week, we'll explore Ambassador Containers – the diplomatic proxies that handle external communication and service discovery. We'll see how they complement adapters to create robust integration patterns.
Questions about adapter patterns or specific transformation challenges? Reply to this newsletter or reach out to me on LinkedIn or X
Happy adapting!