
Autoscaling Inference Workloads: HPA and KEDA for GPU Pods
GPU pods are expensive. Running 4 replicas at 3 AM when traffic is zero wastes thousands per month. Here is how to scale them automatically.

Your vLLM deployment runs 4 replicas 24/7. Each replica uses an A100 80GB. That is 4 GPUs reserved around the clock.
At peak (2 PM), all 4 replicas are busy. Queue depth is high. Users are waiting. You need more capacity.
At 3 AM, traffic drops to near zero. All 4 replicas are idle. GPU utilization is under 5%. You are paying $12/hour for GPUs that are doing nothing.
The Horizontal Pod Autoscaler (HPA) solves this. But GPU workloads have unique challenges that make standard HPA configurations fail. This article covers how to autoscale inference pods correctly.
Why Standard HPA Does Not Work for GPU Pods
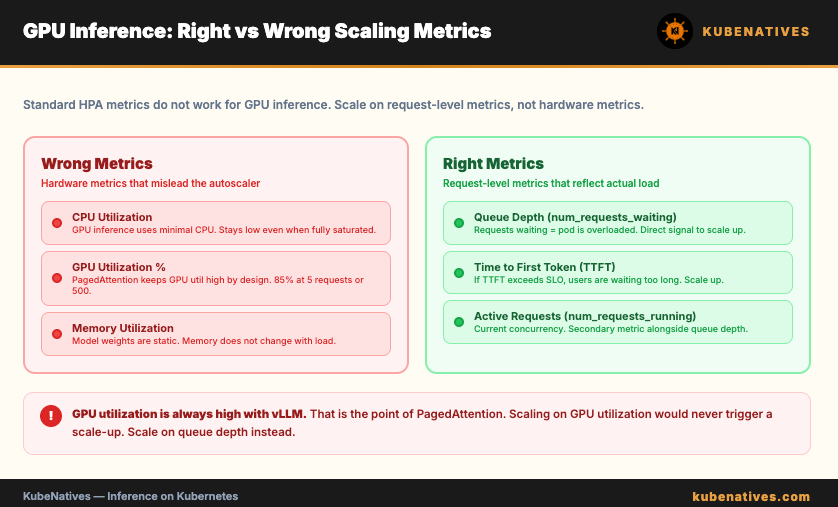
The default HPA scales on CPU utilization. For GPU inference pods, CPU utilization is meaningless. The real work happens on the GPU. CPU stays low even when the model is fully saturated.
GPU utilization is also a bad scaling metric for vLLM. PagedAttention keeps GPU utilization high by design. A vLLM pod at 85% GPU utilization might be handling 5 requests or 500. The utilization number does not tell you if the pod is overloaded.
The right metrics for scaling inference pods are request-level metrics, not hardware metrics.
The Right Scaling Metrics
Queue depth (vllm:num_requests_waiting). This is the number of requests waiting to be processed. If requests are queuing, the pod is overloaded. Scale up.
# HPA scaling on queue depth
apiVersion: autoscaling/v2
kind: HorizontalPodAutoscaler
metadata:
name: vllm-hpa
namespace: inference
spec:
scaleTargetRef:
apiVersion: apps/v1
kind: Deployment
name: vllm-llama3
minReplicas: 2
maxReplicas: 8
metrics:
- type: Pods
pods:
metric:
name: vllm_num_requests_waiting
target:
type: AverageValue
averageValue: "5"
behavior:
scaleUp:
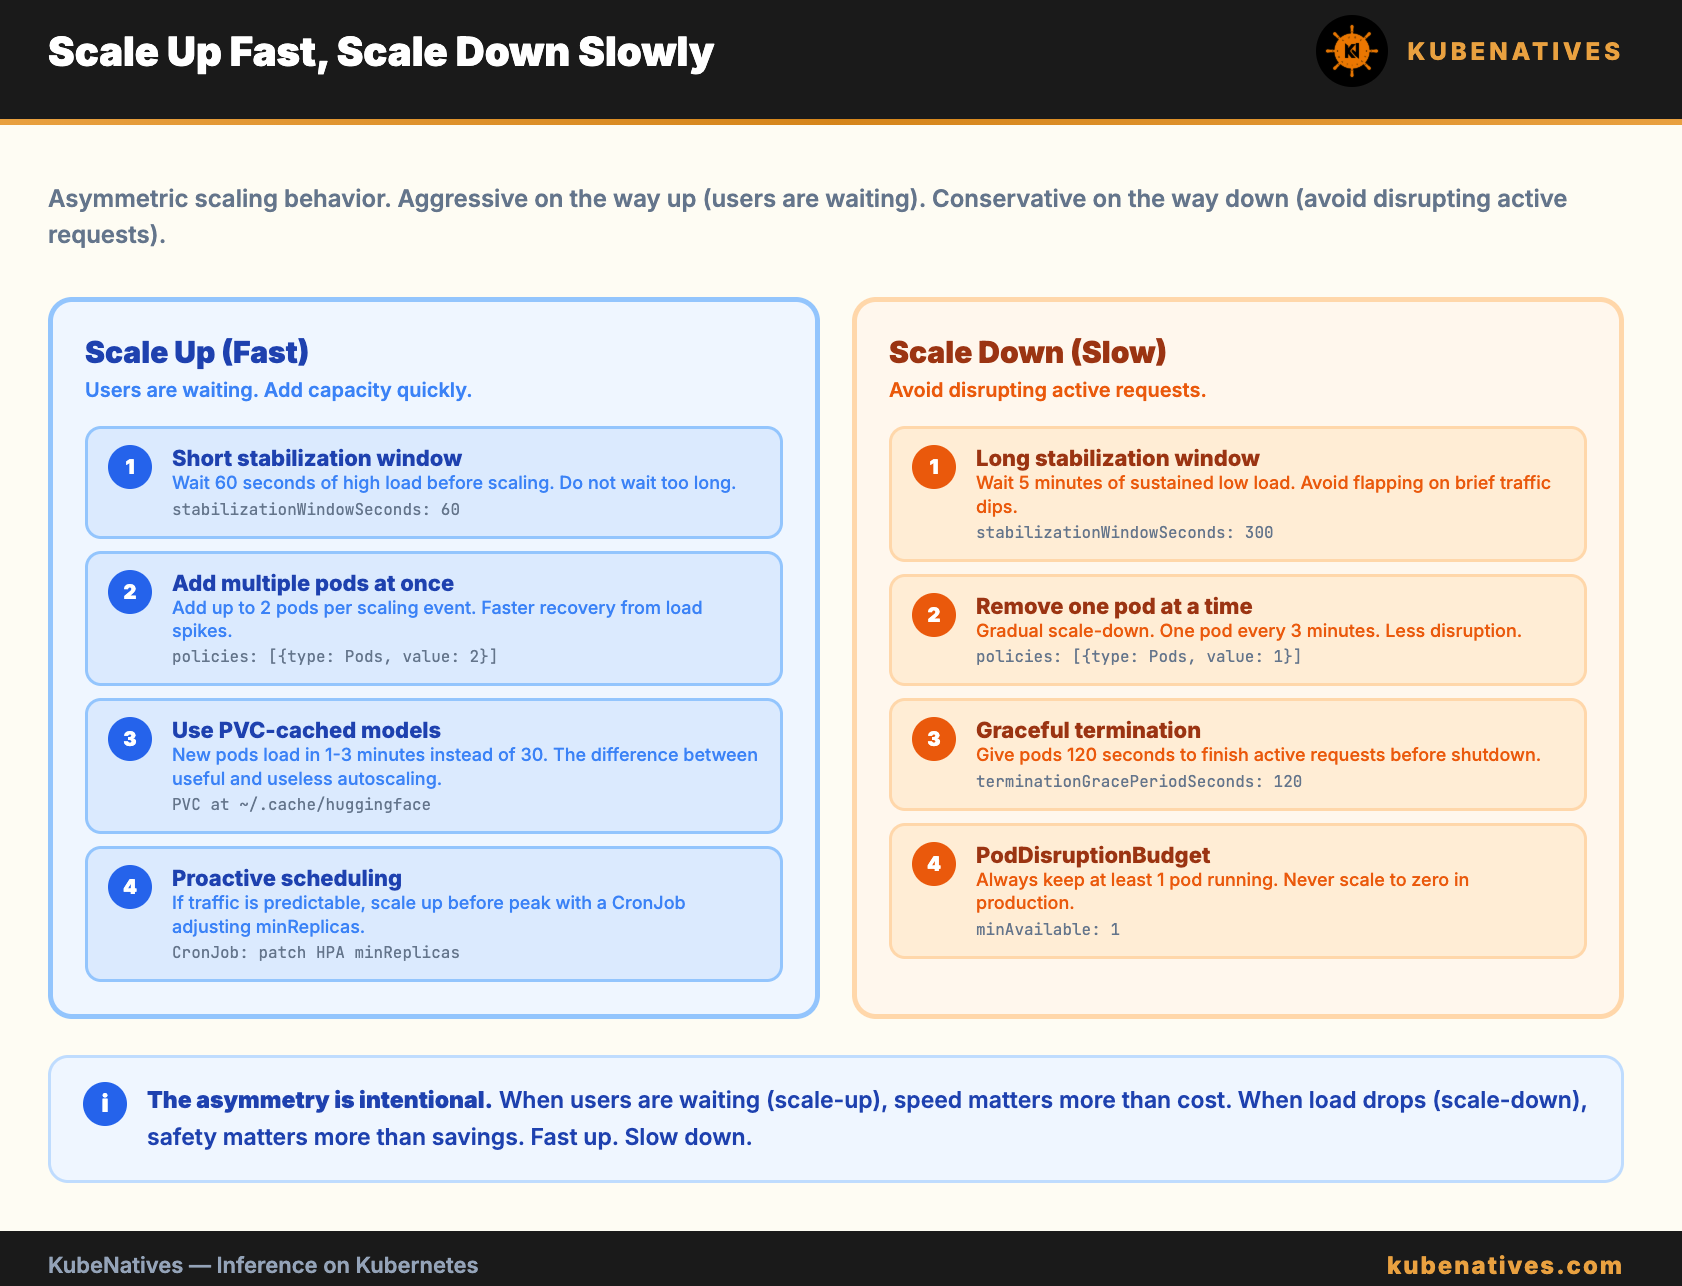
stabilizationWindowSeconds: 60
policies:
- type: Pods
value: 2
periodSeconds: 120
scaleDown:
stabilizationWindowSeconds: 300
policies:
- type: Pods
value: 1
periodSeconds: 180
When the average queue depth across pods exceeds 5 requests, the HPA adds replicas. When it drops below 5, it removes them.
Time to First Token (TTFT). This measures how long users wait before seeing the first token. If TTFT exceeds your SLO (say 500ms), scale up.
Active requests (vllm:num_requests_running). The number of requests currently being processed. This indicates current load, not queued load. Useful as a secondary metric alongside queue depth.
Setting Up Custom Metrics
The HPA needs to read vLLM metrics through the Kubernetes metrics API. This requires a metrics adapter.
Option 1: Prometheus Adapter
The Prometheus Adapter exposes Prometheus metrics as Kubernetes custom metrics. vLLM exports metrics to Prometheus. The adapter makes them available to the HPA.
# Prometheus Adapter configuration
rules:
- seriesQuery: 'vllm:num_requests_waiting{namespace!="",pod!=""}'
  resources:
    overrides:
      namespace: {resource: "namespace"}
      pod: {resource: "pod"}
  name:
    matches: "^(.*)"
    as: "vllm_num_requests_waiting"
  metricsQuery: 'avg(<<.Series>>{<<.LabelMatchers>>}) by (<<.GroupBy>>)'
Option 2: KEDA
KEDA (Kubernetes Event Driven Autoscaling) is simpler to set up than the Prometheus Adapter. It can query Prometheus directly without a separate adapter.
apiVersion: keda.sh/v1alpha1
kind: ScaledObject
metadata:
  name: vllm-scaledobject
  namespace: inference
spec:
  scaleTargetRef:
    name: vllm-llama3
  minReplicaCount: 2
  maxReplicaCount: 8
  cooldownPeriod: 300
  pollingInterval: 15
  triggers:
  - type: prometheus
    metadata:
      serverAddress: http://prometheus.monitoring:9090
      metricName: vllm_queue_depth
      query: |
        avg(vllm:num_requests_waiting{namespace="inference",pod=~"vllm-llama3.*"})
      threshold: "5"
      activationThreshold: "1"
KEDA also supports scaling to zero, which the standard HPA does not. For development environments, this means your GPU pods shut down completely when unused.
The Scale-Up Problem: Model Loading Time
When the HPA triggers a scale-up, a new pod starts. The pod needs to load the model before it can serve requests.
For a 70B model without a PVC cache, that is 15 to 30 minutes. During that time, traffic is still hitting the existing (overloaded) pods. The new replica is not helping yet.
This is the fundamental challenge of autoscaling inference workloads. The scale-up latency is measured in minutes, not seconds.
Fixes:
PVC-backed model cache reduces startup to 1 to 3 minutes. Pre-populated shared storage makes it even faster. These are covered in the vLLM Model Loading article.
Startup probes must have a large enough window. If the startup probe fails before the model loads, the pod gets killed and restarted. An infinite restart loop.
startupProbe:
  httpGet:
    path: /health
    port: 8000
  failureThreshold: 120     # 120 * 10s = 20 minutes
  periodSeconds: 10
Proactive scaling. Instead of reacting to high queue depth, scale up before traffic arrives. If your traffic pattern is predictable (peak at 2 PM, low at 3 AM), use a CronJob to adjust minReplicas on a schedule.
# Scale up before peak hours (1:30 PM)
kubectl patch hpa vllm-hpa -n inference \
  -p '{"spec":{"minReplicas":4}}'

# Scale down after peak (10 PM)
kubectl patch hpa vllm-hpa -n inference \
  -p '{"spec":{"minReplicas":2}}'
The Scale-Down Problem: Disrupting Active Requests
Scaling down terminates a pod. If that pod is in the middle of generating a response, the user gets an error.
Fixes:
Set a generous terminationGracePeriodSeconds. This gives the pod time to finish active requests before shutting down.
spec:
  terminationGracePeriodSeconds: 120
The HPA behavior section controls how aggressively it scales down. Use stabilization windows and slow scale-down policies.
behavior:
  scaleDown:
    stabilizationWindowSeconds: 300    # Wait 5 min of low load
    policies:
    - type: Pods
      value: 1                         # Remove 1 pod at a time
      periodSeconds: 180               # Every 3 minutes
This means: wait for 5 minutes of sustained low load before scaling down. Then remove 1 pod every 3 minutes. Gradual and safe.
A PodDisruptionBudget ensures at least one pod is always running:
apiVersion: policy/v1
kind: PodDisruptionBudget
metadata:
  name: vllm-pdb
  namespace: inference
spec:
  minAvailable: 1
  selector:
    matchLabels:
      app: vllm-llama3
KEDA vs HPA: When to Use Each
Use standard HPA when: You already have the Prometheus Adapter installed. You do not need scale-to-zero. Your scaling logic is simple (one or two metrics).
Use KEDA when: You want to query Prometheus directly without an adapter. You need scale-to-zero for dev environments. You want to scale on external metrics (SQS queue length, Kafka lag, HTTP request rate from an external load balancer).
For most production inference workloads, KEDA is the simpler choice. It handles the metrics pipeline internally and supports more trigger types.
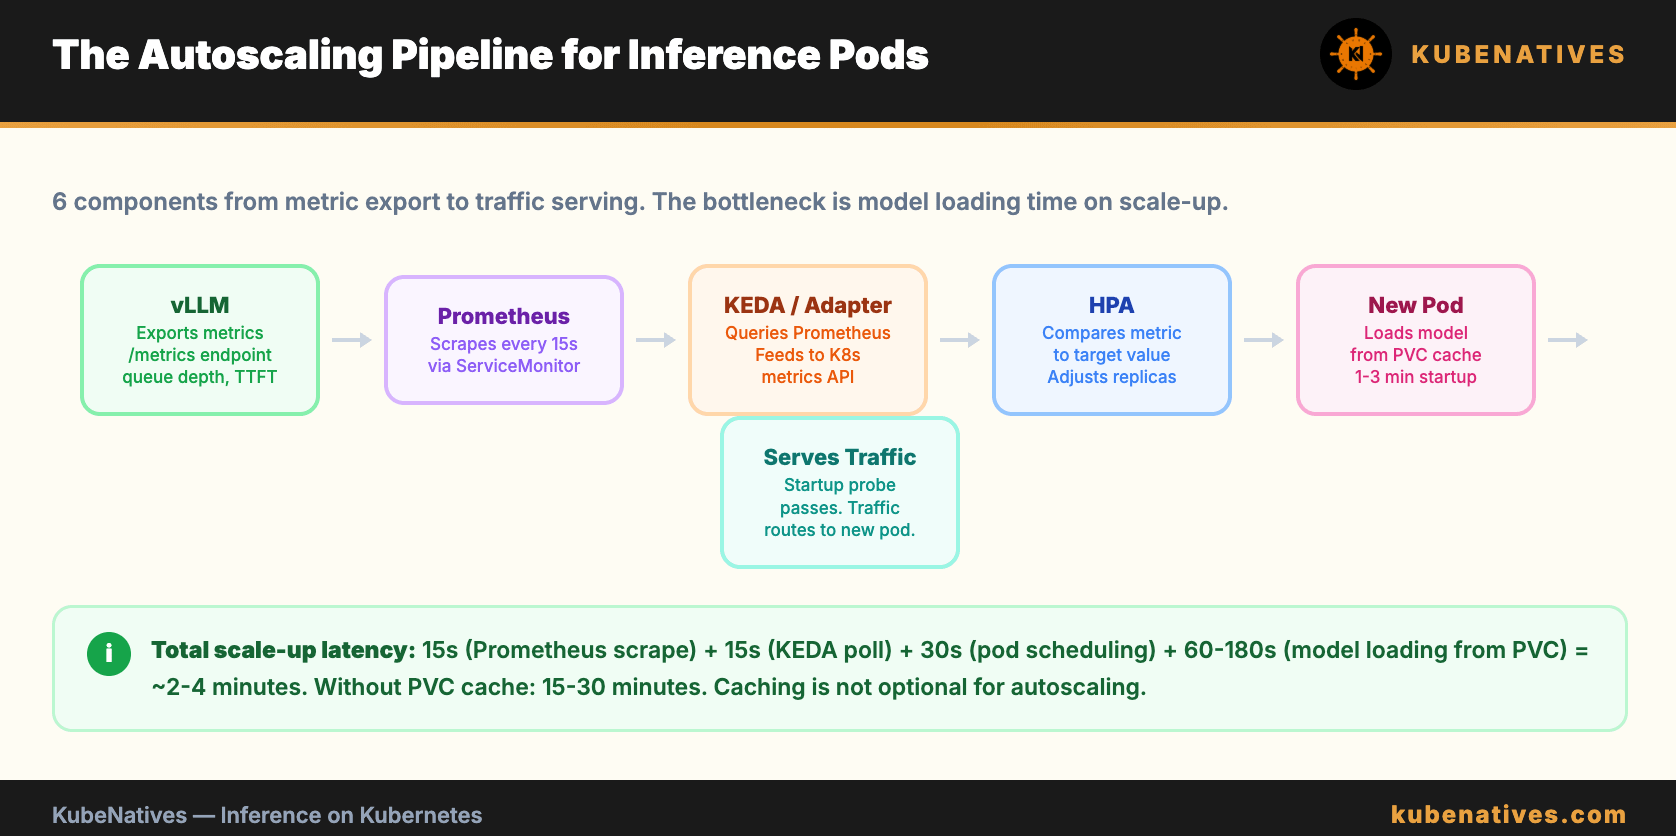
The Complete Autoscaling Stack
vLLM exports metrics → Prometheus scrapes → KEDA queries →
HPA adjusts replicas → New pod starts → Model loads from PVC →
Pod passes startup probe → Traffic routes to new pod
The full stack requires: vLLM with metrics enabled, a ServiceMonitor for Prometheus scraping, KEDA or Prometheus Adapter, an HPA or ScaledObject, PVC-backed model storage for fast startup, and a PodDisruptionBudget for safe scale-down.
The Bottom Line
Do not scale GPU pods on CPU or GPU utilization. Scale on queue depth. Use KEDA for simplicity or Prometheus Adapter for flexibility.
The hard part is not the autoscaling configuration. It is the model loading time on scale-up. Solve that with PVCs and shared storage first. Then add autoscaling on top.
Scale up fast (within 1 to 3 minutes with cached models). Scale down slowly (stabilization windows and one pod at a time). Never scale to zero in production unless you can tolerate cold start latency.
Next week: Resource Requests and Limits for GPU Workloads.
If you are building inference infrastructure on Kubernetes, I cover model serving, GPU scheduling, and autoscaling every week. Subscribe at kubenatives.com.