
GPU Monitoring with DCGM Exporter: The Metrics That Matter
Your GPU nodes are running. nvidia-smi shows green. But are your GPUs healthy, efficient, and about to fail? DCGM tells you.

nvidia-smi is the first tool engineers reach for when checking GPU status. It shows utilization, temperature, memory, and power draw. It works for a single node.
It does not work for a 20 node GPU cluster. You cannot SSH into 20 nodes every time someone reports slow inference. You need GPU metrics in Prometheus, dashboards in Grafana, and alerts that page you before users notice.
DCGM Exporter is the NVIDIA Data Center GPU Manager running as a DaemonSet on every GPU node. It collects GPU health and performance metrics and exports them in Prometheus format. This article covers which metrics matter, how to set up the monitoring stack, and what to alert on.
What DCGM Exporter Collects
DCGM Exporter runs as part of the GPU Operator (component 6 of 8). It scrapes GPU metrics at a configurable interval and exposes them on a /metrics endpoint.
The metrics fall into 4 categories:
Utilization metrics tell you how busy the GPU is.
DCGM_FI_DEV_GPU_UTIL          GPU compute utilization (%)
DCGM_FI_DEV_MEM_COPY_UTIL     Memory controller utilization (%)
DCGM_FI_DEV_ENC_UTIL          Encoder utilization (%)
DCGM_FI_DEV_DEC_UTIL          Decoder utilization (%)
Memory metrics tell you how much VRAM is in use.
DCGM_FI_DEV_FB_USED           Framebuffer (VRAM) used (MB)
DCGM_FI_DEV_FB_FREE           Framebuffer free (MB)
DCGM_FI_DEV_FB_TOTAL          Framebuffer total (MB)
Temperature and power metrics tell you about thermal and electrical health.
DCGM_FI_DEV_GPU_TEMP          GPU temperature (°C)
DCGM_FI_DEV_MEMORY_TEMP       Memory temperature (°C)
DCGM_FI_DEV_POWER_USAGE       Current power draw (W)
DCGM_FI_DEV_TOTAL_ENERGY      Total energy consumed (mJ)
Error metrics tell you about hardware problems before they cause failures.
DCGM_FI_DEV_ECC_SBE_VOL       Single-bit ECC errors (correctable)
DCGM_FI_DEV_ECC_DBE_VOL       Double-bit ECC errors (uncorrectable)
DCGM_FI_DEV_RETIRED_SBE       Retired pages (single-bit)
DCGM_FI_DEV_RETIRED_DBE       Retired pages (double-bit)
DCGM_FI_DEV_XID_ERRORS        XID error codes
The 6 Metrics That Actually Matter
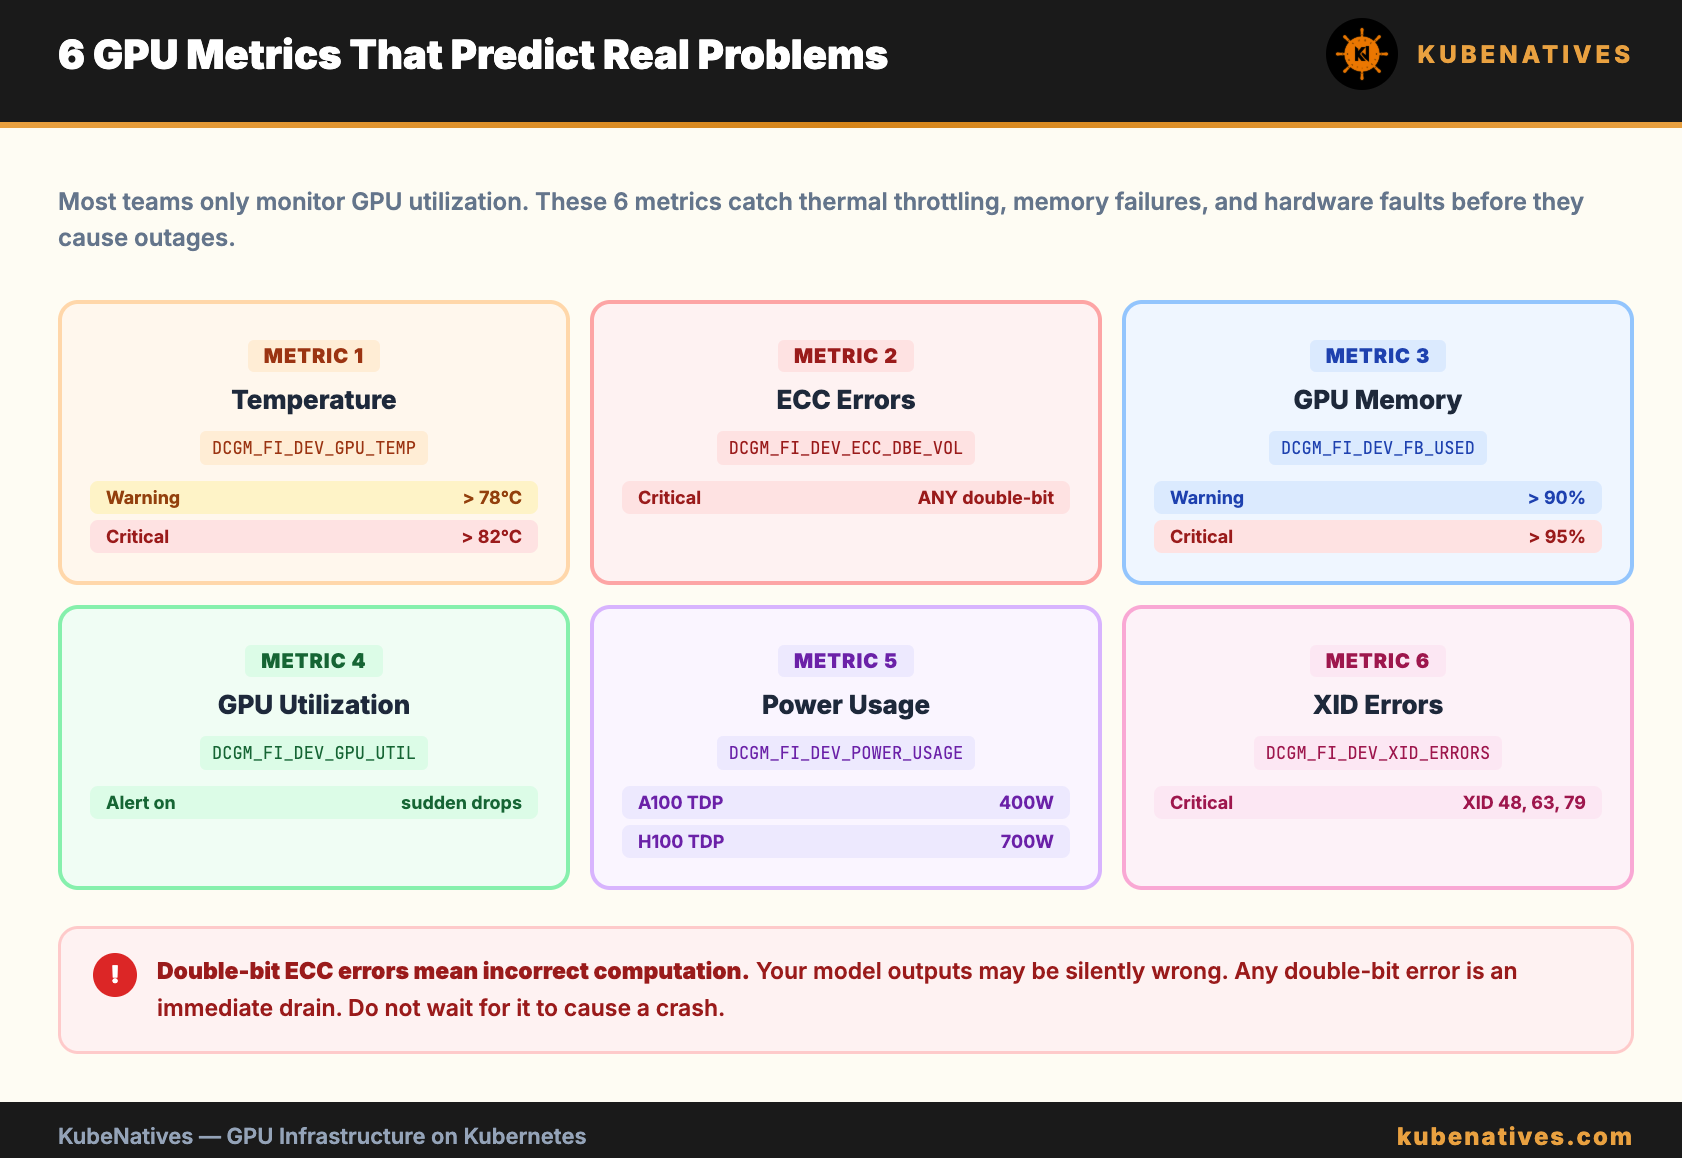
Most teams monitor GPU utilization and nothing else. That is like monitoring CPU utilization and ignoring memory, disk, and network. Here are the 6 metrics that predict real problems.
Metric 1: GPU Temperature (DCGM_FI_DEV_GPU_TEMP)
GPUs thermal throttle at 83°C (A100) or 80°C (H100). When throttled, the GPU reduces clock speed to prevent damage. Performance drops 20 to 40% with no warning in application logs.
Alert threshold: warning at 78°C, critical at 82°C.
Metric 2: ECC Errors (DCGM_FI_DEV_ECC_DBE_VOL)
Double-bit ECC errors are uncorrectable memory errors. They indicate failing GPU memory. A single double-bit error means the GPU is producing incorrect computation results. Your model outputs may be wrong.
Alert threshold: any double-bit error is critical. Drain the node immediately.
Single-bit errors are correctable and normal in small quantities. Alert if the rate exceeds 10 per hour.
Metric 3: GPU Memory Used (DCGM_FI_DEV_FB_USED)
Track the ratio of used to total framebuffer. If memory usage is consistently above 95%, one spike will cause a CUDA out of memory crash.
Alert threshold: warning at 90%, critical at 95%.
Metric 4: GPU Utilization (DCGM_FI_DEV_GPU_UTIL)
For vLLM workloads, GPU utilization is normally high (80 to 95%). A sudden drop to 0% indicates the serving process crashed. A sustained drop to 30 to 40% indicates the model is not receiving requests (traffic routing issue).
Alert on sudden changes, not absolute values.
Metric 5: Power Usage (DCGM_FI_DEV_POWER_USAGE)
A100 TDP is 400W. H100 TDP is 700W. If power draw is consistently at TDP, the GPU is running at maximum capacity. If it drops to near zero while workloads are running, the GPU may have entered a fault state.
Useful for capacity planning and cost attribution.
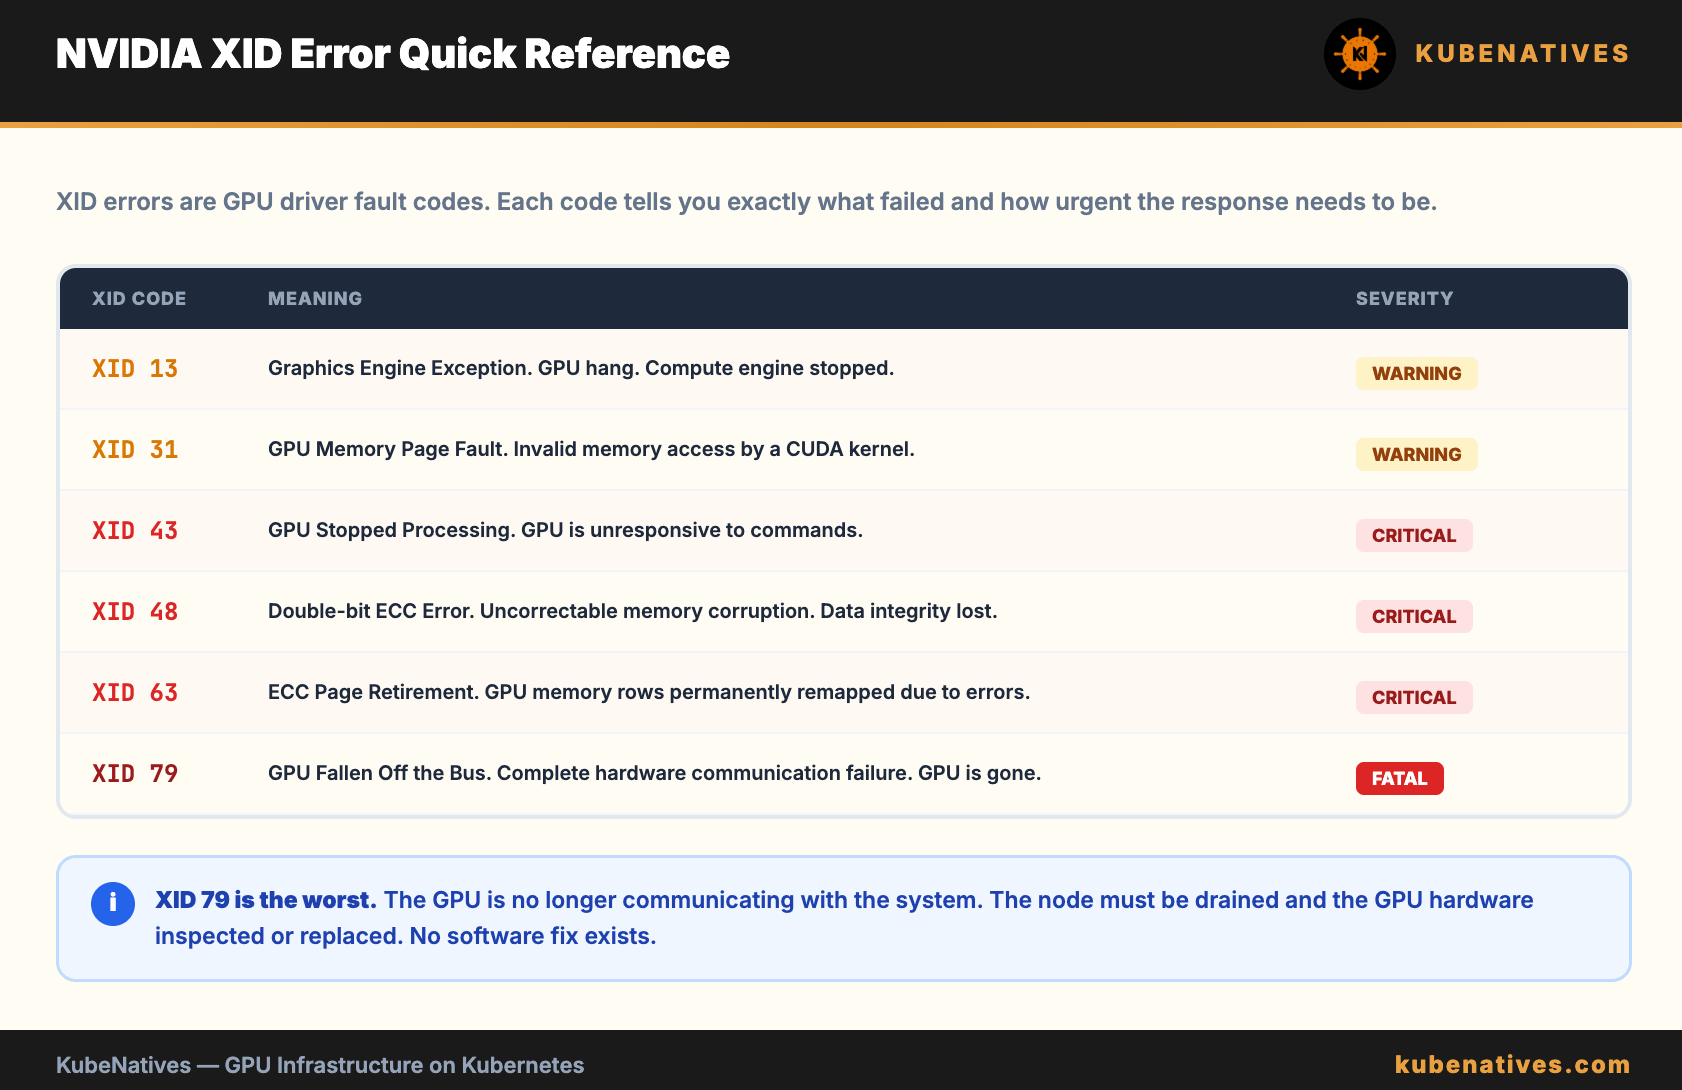
Metric 6: XID Errors (DCGM_FI_DEV_XID_ERRORS)
XID errors are NVIDIA driver error codes. Each code indicates a specific type of failure.
XID 13:  Graphics Engine Exception (GPU hang)
XID 31:  GPU memory page fault
XID 43:  GPU stopped processing
XID 48:  Double-bit ECC error
XID 63:  ECC page retirement (row remapping)
XID 79:  GPU fallen off the bus (hardware failure)
XID 79 is the worst. It means the GPU is no longer communicating with the system. The node needs to be drained and the GPU replaced.
Alert threshold: any XID error is at minimum a warning. XID 48, 63, 79 are critical.
Setting Up the Monitoring Stack
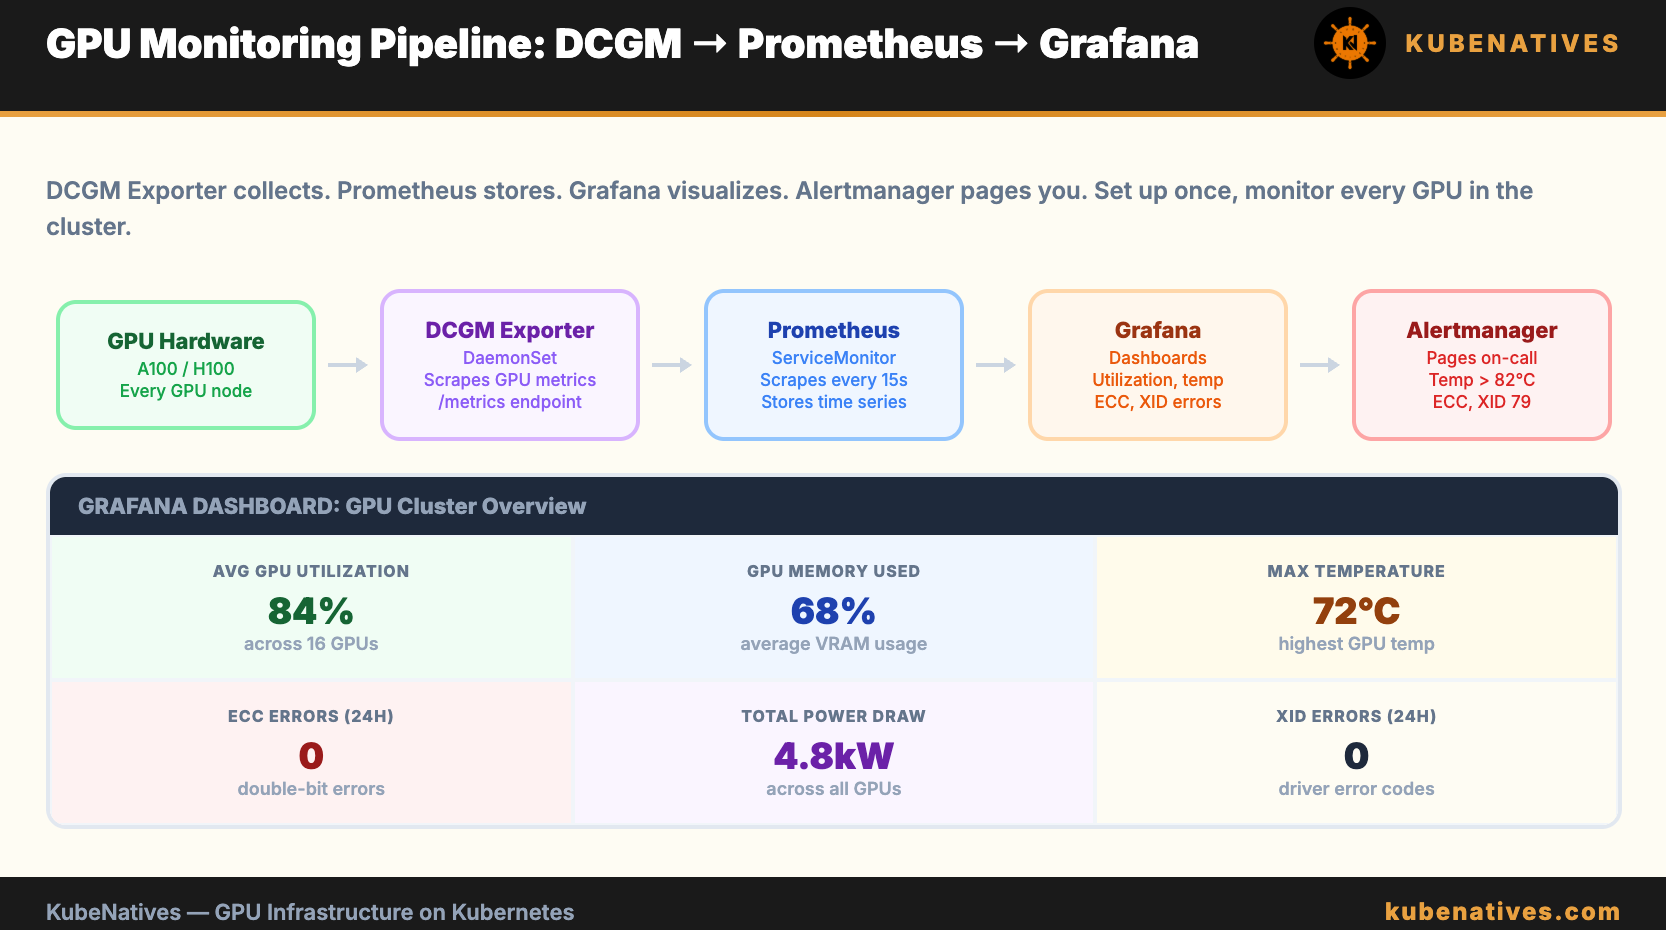
If you installed the GPU Operator, DCGM Exporter is already running. Verify:
kubectl get pods -n gpu-operator -l app=nvidia-dcgm-exporter
All pods should be Running with one pod per GPU node.
ServiceMonitor for Prometheus:
apiVersion: monitoring.coreos.com/v1
kind: ServiceMonitor
metadata:
  name: dcgm-exporter
  namespace: gpu-operator
spec:
  selector:
    matchLabels:
      app: nvidia-dcgm-exporter
  endpoints:
  - port: metrics
    interval: 15s
    path: /metrics
Verify metrics are being scraped:
# Check Prometheus targets
kubectl port-forward -n monitoring svc/prometheus 9090:9090

# In the Prometheus UI, check Status → Targets
# Look for dcgm-exporter targets. All should show UP.
Prometheus Alert Rules
groups:
- name: gpu-health
  rules:
  - alert: GpuTemperatureHigh
    expr: DCGM_FI_DEV_GPU_TEMP > 78
    for: 5m
    labels:
      severity: warning
    annotations:
      summary: "GPU temperature above 78°C on {{ $labels.instance }}"
      description: "GPU {{ $labels.gpu }} is at {{ $value }}°C. Thermal throttling starts at 83°C."

  - alert: GpuTemperatureCritical
    expr: DCGM_FI_DEV_GPU_TEMP > 82
    for: 2m
    labels:
      severity: critical
    annotations:
      summary: "GPU temperature critical on {{ $labels.instance }}"

  - alert: GpuDoubleBitEcc
    expr: DCGM_FI_DEV_ECC_DBE_VOL > 0
    for: 0m
    labels:
      severity: critical
    annotations:
      summary: "Uncorrectable ECC error on GPU {{ $labels.gpu }}"
      description: "Double-bit ECC error detected. GPU memory is producing incorrect results. Drain the node."

  - alert: GpuMemoryNearFull
    expr: (DCGM_FI_DEV_FB_USED / DCGM_FI_DEV_FB_TOTAL) > 0.95
    for: 5m
    labels:
      severity: warning
    annotations:
      summary: "GPU memory above 95% on {{ $labels.gpu }}"

  - alert: GpuUtilizationDrop
    expr: DCGM_FI_DEV_GPU_UTIL < 10 and DCGM_FI_DEV_GPU_UTIL offset 10m > 50
    for: 5m
    labels:
      severity: warning
    annotations:
      summary: "GPU utilization dropped suddenly on {{ $labels.gpu }}"
      description: "GPU util was above 50% and is now below 10%. Serving process may have crashed."

  - alert: GpuXidError
    expr: DCGM_FI_DEV_XID_ERRORS > 0
    for: 0m
    labels:
      severity: warning
    annotations:
      summary: "XID error {{ $value }} on GPU {{ $labels.gpu }}"

  - alert: GpuHighSingleBitEcc
    expr: rate(DCGM_FI_DEV_ECC_SBE_VOL[1h]) > 10
    for: 5m
    labels:
      severity: warning
    annotations:
      summary: "Elevated single-bit ECC error rate on {{ $labels.gpu }}"
Grafana Dashboard: Essential Panels
Build a dashboard with these panels. Group by node and GPU index.
Row 1: Overview
GPU utilization per GPU (time series, 0 to 100%)
GPU memory used vs total per GPU (bar gauge)
GPU temperature per GPU (time series with 78°C and 82°C threshold lines)
Row 2: Health
ECC errors (single-bit and double-bit) per GPU (stat panel, instant value)
XID errors per GPU (table, last 24 hours)
Power draw per GPU (time series, with TDP line)
Row 3: Cluster Overview
Total GPUs allocated vs available (stat panel)
Average GPU utilization across all GPUs (gauge)
Nodes with GPU temperature above 78°C (table, filtered)
Common Issues DCGM Catches Early
Cooling failure. Temperature creeps up over days. DCGM shows the trend. You schedule maintenance before the GPU throttles.
Failing GPU memory. Single-bit ECC errors increase gradually. Then a double-bit error occurs. DCGM catches the trend. You drain the node before the GPU produces incorrect model outputs.
GPU fallen off the bus. XID 79. The GPU stops responding. DCGM reports the error. Without DCGM, you find out when users report that inference is not working and someone SSHs into the node.
Silent performance degradation. GPU utilization drops from 85% to 40% but no application errors. The serving process is healthy but something changed (model was reloaded, batch size decreased, traffic routing shifted). DCGM’s utilization trend catches the change.
The Bottom Line
nvidia-smi is for debugging one node. DCGM Exporter is for monitoring a cluster. If you run GPU workloads in production, DCGM metrics in Prometheus with alert rules are not optional.
Monitor 6 metrics: temperature, ECC errors, memory usage, utilization, power, and XID errors. Alert on the thresholds above. Build a Grafana dashboard for visibility.
The GPU that fails silently costs you more than the GPU that fails loudly. DCGM makes silent failures visible.
Next week: Service Mesh Debugging on Kubernetes: When Istio Breaks Your Inference Pipeline.
If you are running GPU clusters in production, I cover monitoring, model serving, and infrastructure operations every week. Subscribe at kubenatives.com.