
Why Your GPU Pods Are Pending: Debugging Kubernetes GPU Scheduling
Every reason a GPU pod gets stuck in Pending. Every debug command. Root cause in under 5 minutes.

Your GPU pod has been Pending for 10 minutes. kubectl describe shows:
0/12 nodes are available: 12 Insufficient nvidia.com/gpu.
You have 12 GPU nodes. nvidia-smi works on all of them. The GPUs are physically there.
So why does Kubernetes think there are no GPUs available?
There are exactly 7 reasons this happens. This article covers all of them in order of likelihood. Work through them top to bottom. You will find the root cause in under 5 minutes
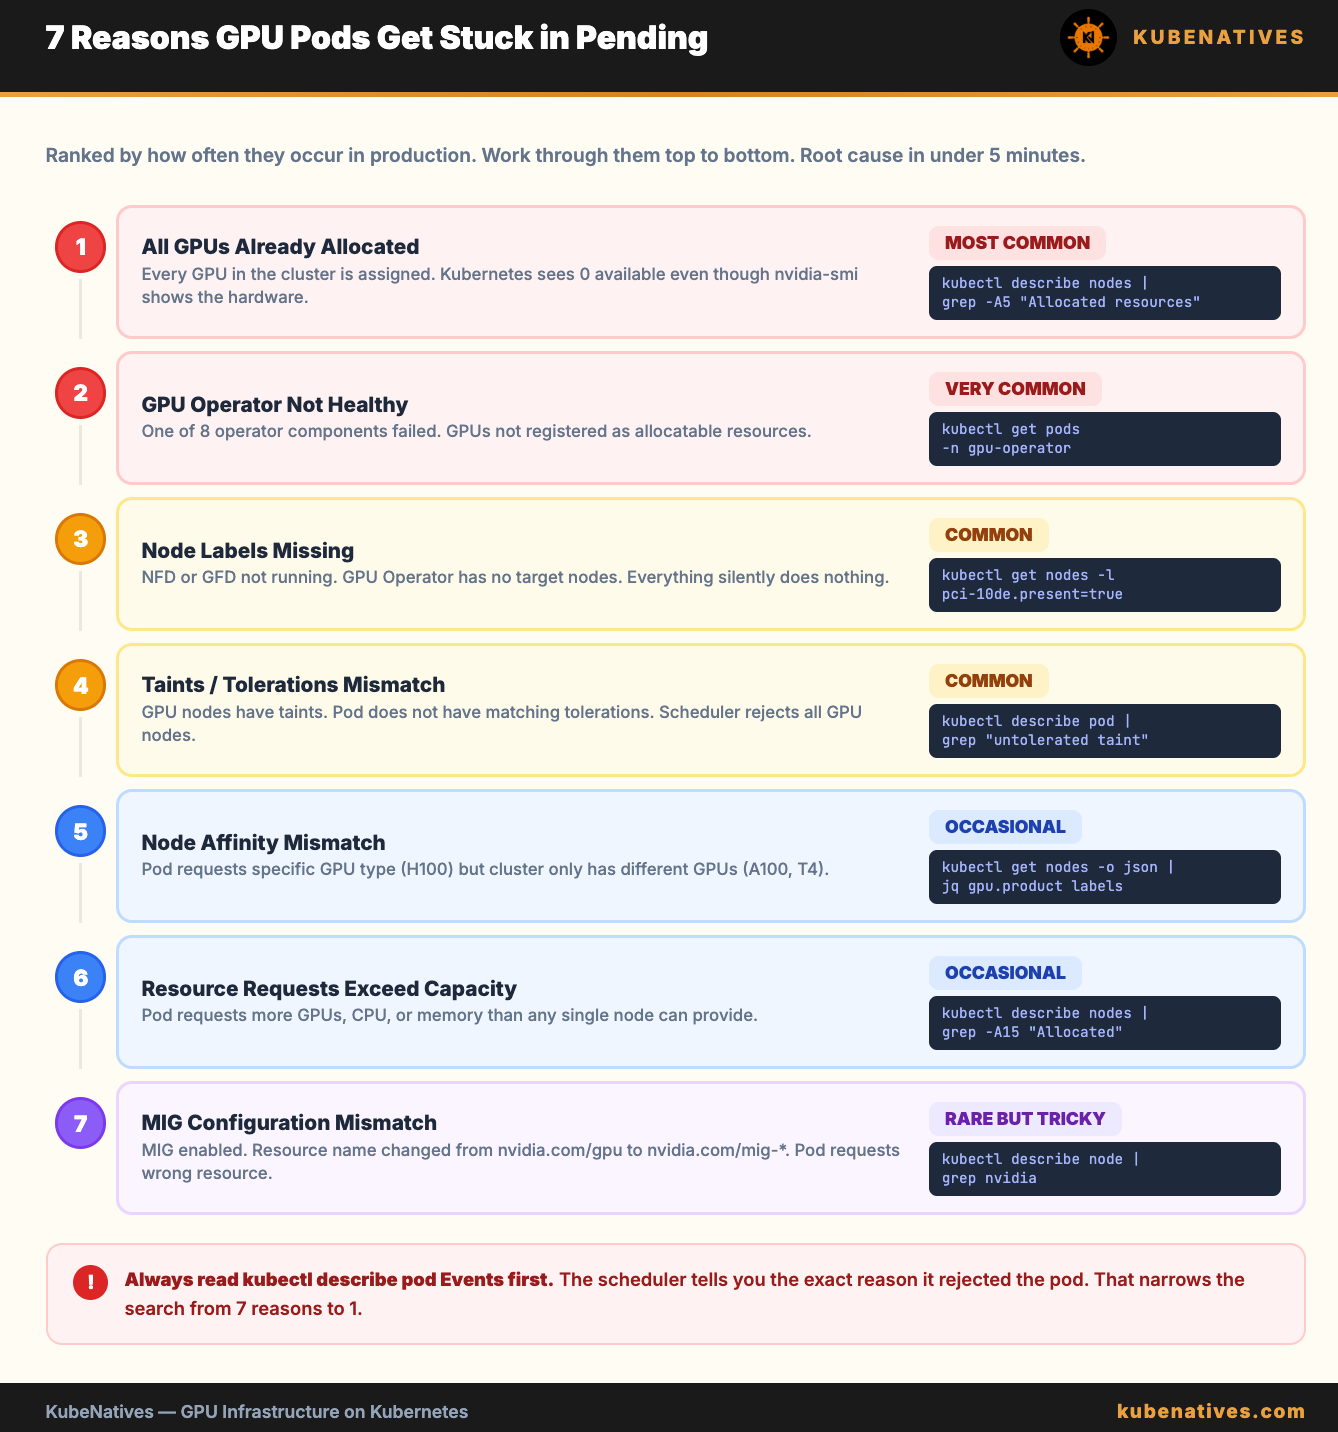
Reason 1: All GPUs Are Already Allocated
This is the most common cause. And the most misunderstood.
Kubernetes treats GPUs as integers. When a pod requests nvidia.com/gpu: 1, it gets an entire physical GPU. There is no fractional allocation. A pod using 8GB of an 80GB A100 still consumes 1 full GPU from the allocatable pool.
Check the actual allocation:
# Show allocatable vs allocated GPUs on each node
kubectl describe nodes | grep -A5 "Allocated resources" | grep -B1 "nvidia.com/gpu"
If allocated equals allocatable on every node, you do not have a scheduling bug. You have a capacity problem.
The fix:
Add more GPU nodes. Or enable GPU sharing (MIG, Time-Slicing, or MPS) to run multiple workloads per physical GPU. We covered all three sharing strategies in detail in the MIG vs Time-Slicing vs MPS article.
Quick capacity check:
# Total GPUs in the cluster
kubectl get nodes -l nvidia.com/gpu.present=true \
  -o jsonpath='{range .items[*]}{.metadata.name}{"\t"}{.status.allocatable.nvidia\.com/gpu}{"\n"}{end}'
Reason 2: The GPU Operator Is Not Healthy
This is the second most common cause. The NVIDIA GPU Operator has 8 components that form a dependency chain. If any component fails, GPUs do not show up as allocatable resources.
# Check GPU Operator pod status
kubectl get pods -n gpu-operator
Every pod should be Running or Completed. If any pod is in CrashLoopBackOff, Init, or Error, that is your problem.
The dependency chain: NFD → Driver → Container Toolkit → Device Plugin → GFD → DCGM → MIG Manager → Validator.
The first unhealthy pod in this chain is your root cause. Everything below it is a symptom.
Common failures:
Driver pod crashing. The nouveau kernel module conflicts with the NVIDIA driver. Or the driver container cannot compile kernel modules for your host kernel version. On managed Kubernetes (EKS, GKE, AKS), the platform pre-installs drivers. Set driver.enabled=false in the GPU Operator ClusterPolicy.
Device plugin not running. It depends on the container toolkit. If the toolkit did not configure the runtime correctly, the device plugin cannot register GPUs. Fix the toolkit first.
Validator stuck in Init:0/4. Do not debug the validator. It is reporting that something upstream failed. Look up the chain.
We covered all 8 components in detail in the NVIDIA GPU Operator article.
Reason 3: Node Labels Are Missing
The GPU Operator uses node labels to decide where to deploy its components. If the labels are missing, the operator has no targets.
# Check for NVIDIA PCI device labels (set by NFD)
kubectl get nodes -l feature.node.kubernetes.io/pci-10de.present=true
If this returns nothing, Node Feature Discovery is not running. Without it, the GPU Operator does not know which nodes have GPUs.
# Check NFD pods
kubectl get pods -n gpu-operator -l app.kubernetes.io/component=worker
Also check for GPU Feature Discovery labels:
# Check GPU-specific labels
kubectl get node <gpu-node> -o json | \
  jq '.metadata.labels | with_entries(select(.key | startswith("nvidia.com")))'
If you see no nvidia.com/gpu.product or nvidia.com/gpu.count labels, GFD is not running or not healthy.
Reason 4: Taints and Tolerations Mismatch
GPU nodes often have taints to prevent non-GPU workloads from being scheduled on them. If your GPU pod does not have the matching toleration, the scheduler rejects it.
# Check taints on GPU nodes
kubectl get nodes -l nvidia.com/gpu.present=true \
  -o jsonpath='{range .items[*]}{.metadata.name}{"\t"}{.spec.taints}{"\n"}{end}'
Common GPU node taints:
nvidia.com/gpu=present:NoSchedule
Your pod spec needs the matching toleration:
tolerations:
- key: nvidia.com/gpu
  operator: Exists
  effect: NoSchedule
The describe pod output will tell you if taints are the issue:
kubectl describe pod <pending-pod>
# Look for: "0/12 nodes are available: 12 node(s) had untolerated taint"
If you see “untolerated taint” in the Events section, add the toleration to your pod spec.
Reason 5: Node Affinity Mismatch
If your pod requests a specific GPU type using node affinity, and no nodes match, the pod stays Pending.
# Example: pod requires H100 but cluster only has A100s
affinity:
  nodeAffinity:
    requiredDuringSchedulingIgnoredDuringExecution:
      nodeSelectorTerms:
      - matchExpressions:
        - key: nvidia.com/gpu.product
          operator: In
          values:
          - NVIDIA-H100-80GB-HBM3
Check what GPU types actually exist in your cluster:
# List all GPU types across nodes
kubectl get nodes -l nvidia.com/gpu.present=true \
  -o jsonpath='{range .items[*]}{.metadata.name}{"\t"}{.metadata.labels.nvidia\.com/gpu\.product}{"\n"}{end}'
The describe pod output will show:
0/12 nodes are available: 12 node(s) didn't match Pod's node affinity/selector
The fix: Either change the node affinity to match your actual GPU types, or add nodes with the requested GPU type.
Reason 6: Resource Requests Exceed Node Capacity
Your pod requests more GPUs than any single node has. Or the pod requests a combination of GPU, CPU, and memory that no node can satisfy.
# Check your pod's resource requests
kubectl get pod <pending-pod> -o jsonpath='{.spec.containers[*].resources}'
# Check what's available on each GPU node
kubectl describe nodes | grep -A15 "Allocated resources"
Common scenarios:
A pod requests nvidia.com/gpu: 4 but your nodes only have 2 GPUs each. No single node can satisfy the request.
A pod requests nvidia.com/gpu: 1 and memory: 256Gi but GPU nodes only have 128Gi of RAM. The GPU is available but the memory is not.
A pod with tensor parallelism requests 8 GPUs. You have 8 GPUs across 4 nodes (2 each). Tensor parallelism requires all GPUs on the same node. No node has 8.
The fix: Reduce the resource requests, add larger nodes, or use a different parallelism strategy.
Reason 7: MIG Configuration Mismatch
If MIG is enabled on your GPUs, the resource names change. Instead of nvidia.com/gpu, MIG instances are advertised as specific profile resources:
nvidia.com/mig-1g.10gb
nvidia.com/mig-2g.20gb
nvidia.com/mig-3g.40gb
nvidia.com/mig-7g.80gb
A pod requesting nvidia.com/gpu: 1 will not match a MIG-enabled node. The node no longer advertises nvidia.com/gpu. It advertises the MIG profile resources instead.
# Check what GPU resources the node advertises
kubectl describe node <gpu-node> | grep nvidia
If you see nvidia.com/mig-* resources instead of nvidia.com/gpu, your pod needs to request the specific MIG profile:
resources:
  limits:
    nvidia.com/mig-3g.40gb: 1
The describe pod output is not always clear about this. It will say “Insufficient nvidia.com/gpu” even though the real issue is that the resource name has changed because MIG is enabled.
The 5-Minute Debug Script
Save this script. Run it first every time a GPU pod is Pending.
#!/bin/bash
echo "=============================="
echo "GPU Pod Pending Debug Script"
echo "=============================="

echo ""
echo "=== 1. Pending GPU Pods ==="
kubectl get pods --all-namespaces --field-selector=status.phase=Pending \
  -o custom-columns=NS:.metadata.namespace,NAME:.metadata.name,NODE:.spec.nodeName | head -20

echo ""
echo "=== 2. GPU Operator Health ==="
kubectl get pods -n gpu-operator --no-headers | awk '{print $1, $3}' | grep -v Running | grep -v Completed
NOT_RUNNING=$(kubectl get pods -n gpu-operator --no-headers | awk '{print $3}' | grep -v Running | grep -v Completed | wc -l)
if [ "$NOT_RUNNING" -eq 0 ]; then
  echo "All GPU Operator pods healthy."
else
  echo "WARNING: $NOT_RUNNING GPU Operator pods are NOT healthy."
fi

echo ""
echo "=== 3. GPU Node Labels ==="
kubectl get nodes -l feature.node.kubernetes.io/pci-10de.present=true \
  -o custom-columns=NAME:.metadata.name,GPU:.metadata.labels.nvidia\\.com/gpu\\.product,COUNT:.metadata.labels.nvidia\\.com/gpu\\.count 2>/dev/null
NODE_COUNT=$(kubectl get nodes -l feature.node.kubernetes.io/pci-10de.present=true --no-headers 2>/dev/null | wc -l)
if [ "$NODE_COUNT" -eq 0 ]; then
  echo "WARNING: No nodes with GPU labels found. NFD may not be running."
fi

echo ""
echo "=== 4. GPU Allocation ==="
for node in $(kubectl get nodes -l feature.node.kubernetes.io/pci-10de.present=true -o name 2>/dev/null); do
  echo "--- $node ---"
  kubectl describe $node | grep -A3 "nvidia.com"
done

echo ""
echo "=== 5. GPU Node Taints ==="
kubectl get nodes -l feature.node.kubernetes.io/pci-10de.present=true \
  -o custom-columns=NAME:.metadata.name,TAINTS:.spec.taints 2>/dev/null

echo ""
echo "=== 6. Pending Pod Events ==="
PENDING_POD=$(kubectl get pods --all-namespaces --field-selector=status.phase=Pending -o jsonpath='{.items[0].metadata.name}' 2>/dev/null)
PENDING_NS=$(kubectl get pods --all-namespaces --field-selector=status.phase=Pending -o jsonpath='{.items[0].metadata.namespace}' 2>/dev/null)
if [ -n "$PENDING_POD" ]; then
  echo "Events for $PENDING_NS/$PENDING_POD:"
  kubectl describe pod $PENDING_POD -n $PENDING_NS | tail -20
else
  echo "No pending pods found."
fi

echo ""
echo "=============================="
echo "Debug complete."
echo "=============================="
This script checks all 7 reasons in order. In 30 seconds you know whether the problem is capacity, the GPU Operator, labels, taints, affinity, resources, or MIG configuration.
The Decision Tree
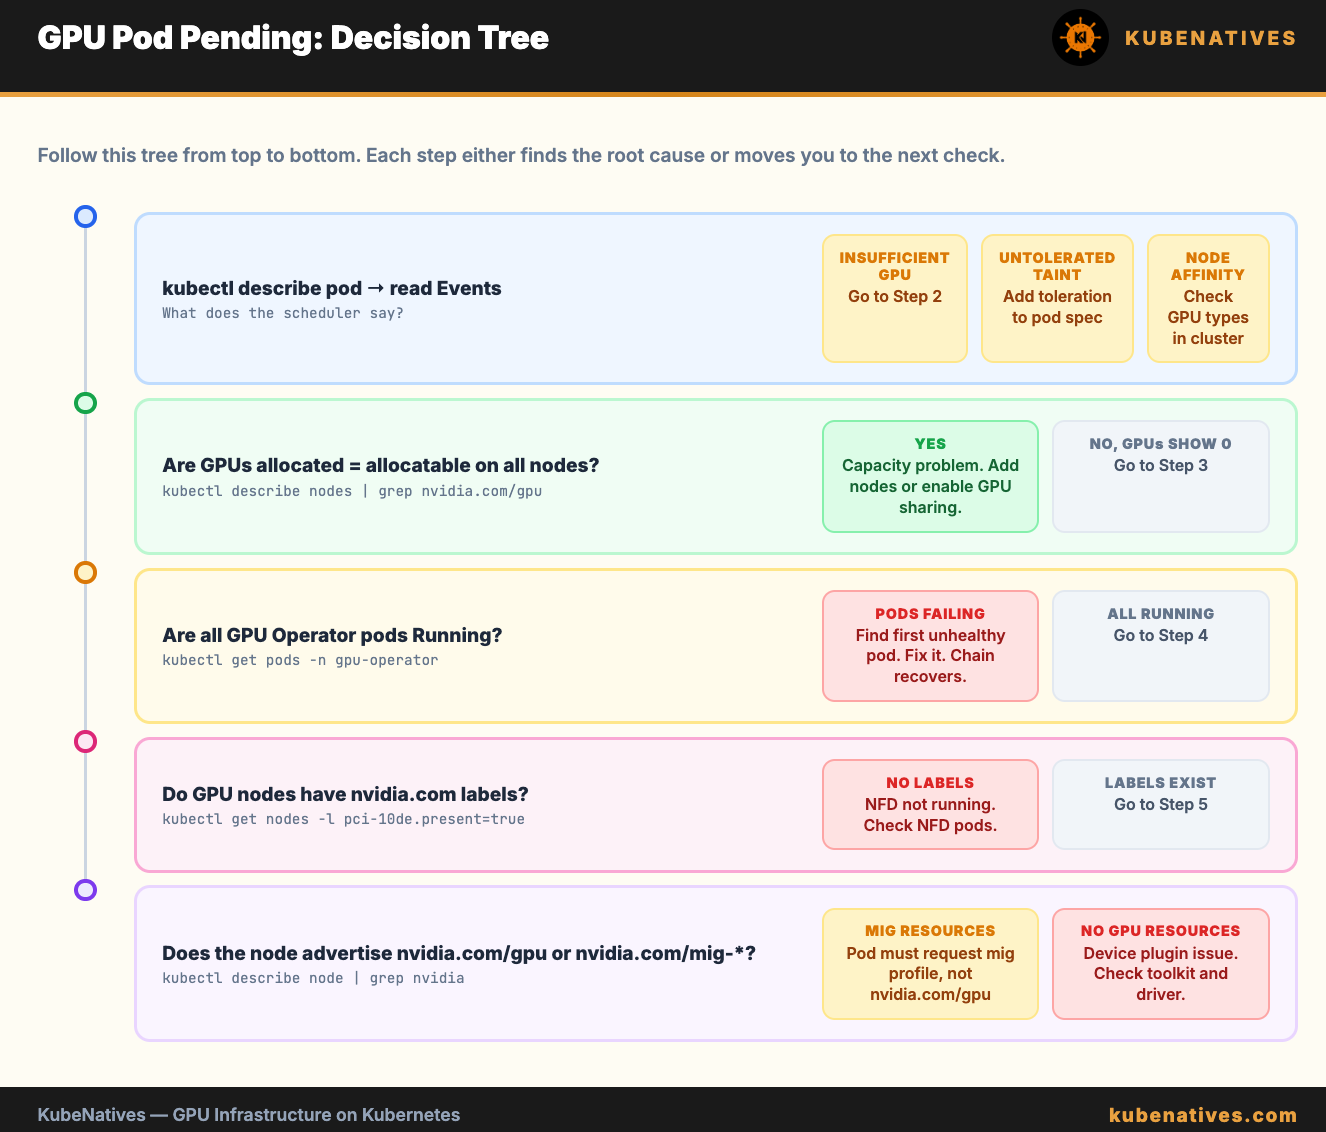
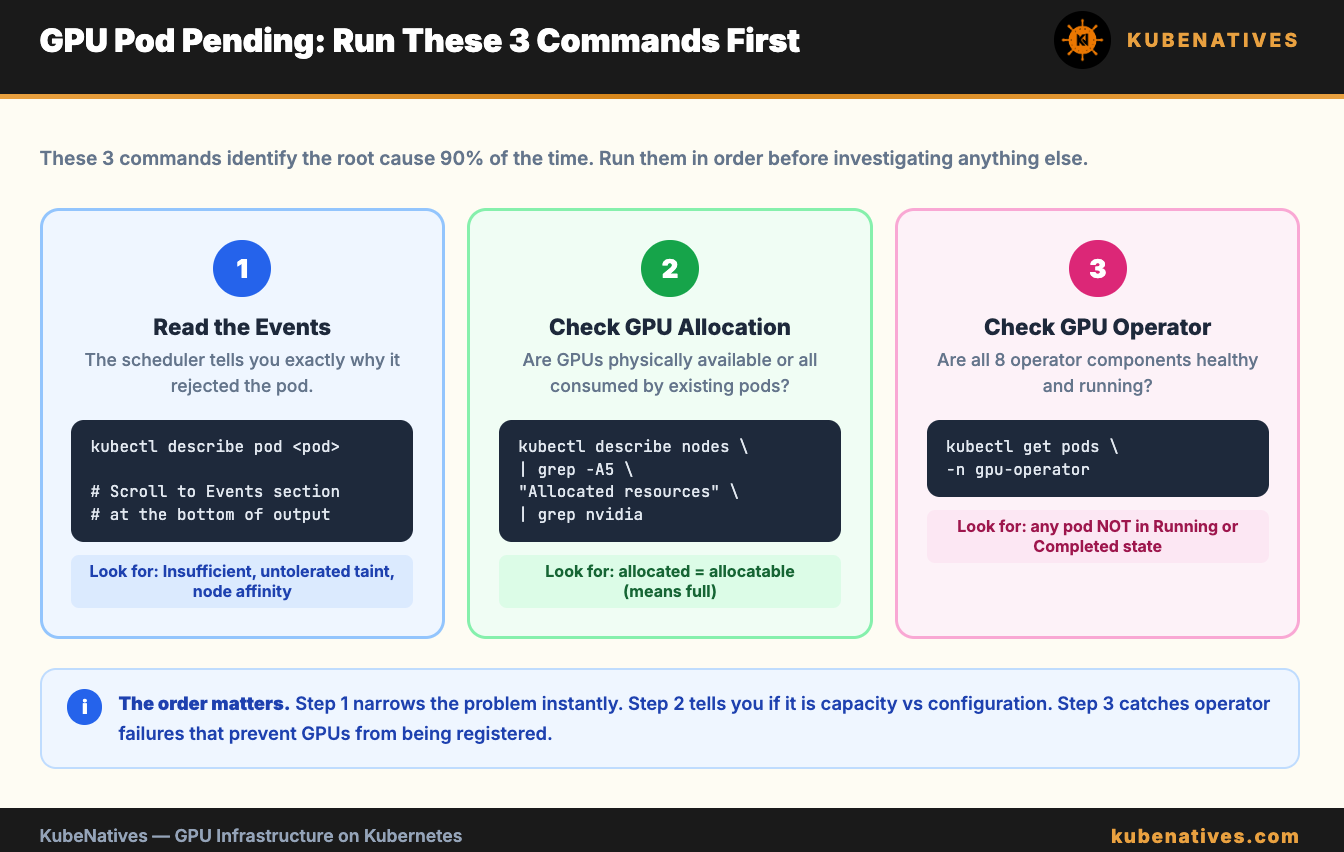
When a GPU pod is Pending, follow this exact order:
Step 1. Read the Events section in kubectl describe pod. It tells you the scheduler’s exact reason for rejection.
Step 2. If “Insufficient nvidia.com/gpu”: check allocation. Are all GPUs already in use?
Step 3. If GPUs show 0 allocatable: check the GPU Operator. kubectl get pods -n gpu-operator.
Step 4. If GPU Operator pods are healthy but GPUs are not allocatable: check node labels. Is NFD running?
Step 5. If “untolerated taint”: add the toleration to your pod spec.
Step 6. If “node affinity/selector”: check what GPU types actually exist vs what the pod requests.
Step 7. If MIG is enabled: check that the pod requests the MIG profile resource, not nvidia.com/gpu.
Start at Step 1. The Events section narrows the search immediately. Do not skip it.
The Bottom Line
GPU pods get stuck in Pending for 7 reasons. 6 of them are configuration issues, not hardware problems.
Read the Events section first. Run the debug script second. The root cause is almost always visible within 30 seconds.
The hardest part is not finding the problem. It is resisting the urge to blame the scheduler when the answer is sitting in kubectl describe pod.
Next week: Kubernetes DNS Troubleshooting: CoreDNS, ndots, and the 5-Second Timeout.
If you are building GPU infrastructure on Kubernetes, I cover this intersection every week. Subscribe at kubenatives.com.