
How Kubernetes Schedules GPUs: Device Plugins, MIG, and Time-Slicing
Kubernetes treats a $30K A100 like a CPU core as a simple integer. Here’s what actually happens when you request nvidia.com/gpu: 1 — and how to stop wasting 80% of your GPU capacity

Your GPU pods have been pending for 20 minutes. You run kubectl describe pod and see:
0/12 nodes are available: 12 Insufficient nvidia.com/gpu.
Twelve nodes. All with GPUs. All “fully allocated.” But when you SSH into one and run nvidia-smi, the GPU is sitting at 15% utilization.
Kubernetes told you there’s no capacity. The GPU itself disagrees.
This is the fundamental disconnect in GPU scheduling on Kubernetes — and understanding why it happens is the difference between a $30K/month GPU bill and a $10K one.
How the Default Device Plugin Actually Works
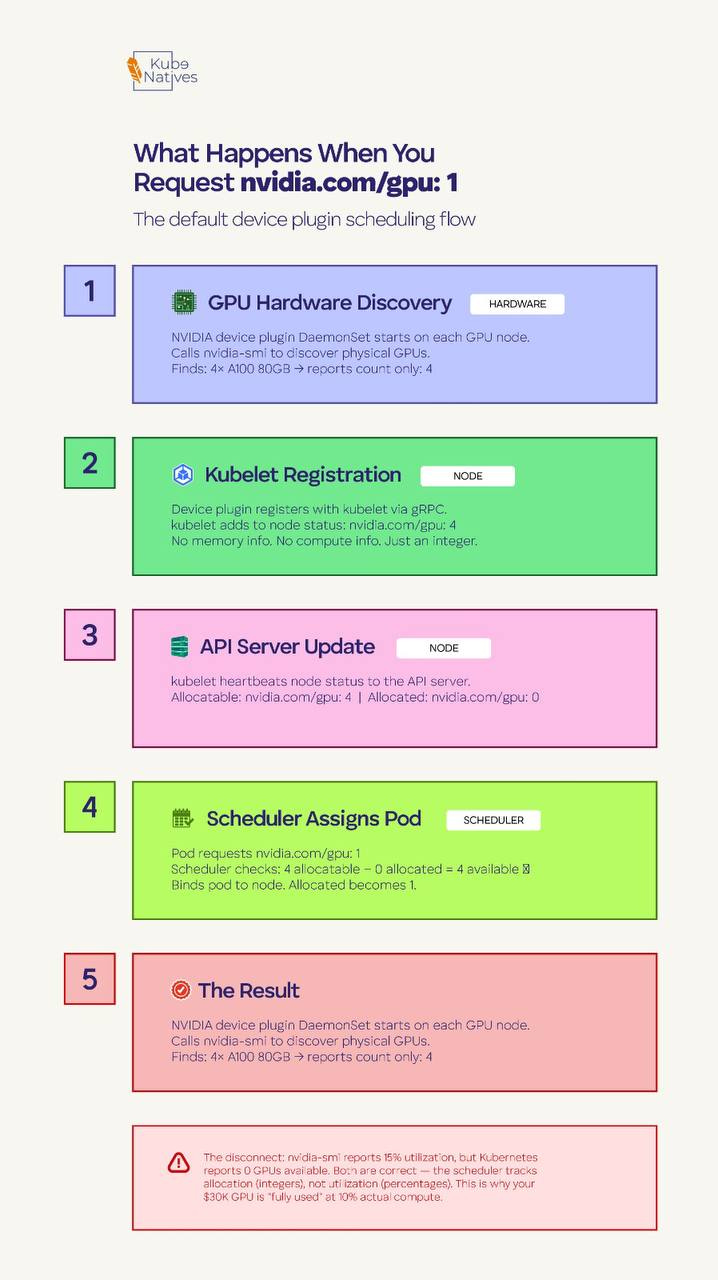
When you add nvidia.com/gpu: 1 to your pod spec, here’s what happens underneath:
The NVIDIA device plugin runs as a DaemonSet on every GPU node. On startup, it calls nvidia-smi to discover the physical GPUs, then registers them with the kubelet using the Kubernetes Device Plugin API. It tells the kubelet: “This node has 4 GPUs available.”
That’s it. No memory information. No compute capability. No SM occupancy. Just a count.
The kubelet reports this to the API server as an extended resource — nvidia.com/gpu: 4 — and the scheduler treats it identically to how it treats CPU or memory. Pod requests 1 GPU, node has 1 available, schedule it.
The critical thing to understand is that the Kubernetes scheduler has zero visibility into what’s happening inside that GPU. It doesn’t know whether your workload uses 2GB or 80GB of VRAM. It doesn’t know if compute utilization is at 5% or 95%. It allocated one integer, and that GPU is now “taken.”
This means a 7B parameter model using 8GB of VRAM on an 80GB A100 and a 70B model using 75GB both consume exactly the same resource from the scheduler’s perspective: one GPU.
Your nvidia-smi output says 15% utilization. Kubernetes says the GPU is fully allocated. Both are correct — they’re just measuring completely different things.
Why This Binary Model Exists
This isn’t a design flaw — it’s a design trade-off.
The Kubernetes device plugin framework was built to be generic. It handles GPUs, FPGAs, InfiniBand adapters, and any other hardware device through the same interface. That interface is intentionally simple: advertise a count, allocate whole units.
The alternative is having the scheduler understand GPU memory, compute units, memory bandwidth, NVLink topology, and SM occupancy — would mean building GPU-specific scheduling logic into the core Kubernetes scheduler.
The K8s maintainers deliberately avoided this. Hardware-specific intelligence belongs in plugins and external schedulers, not in the core.
The result is a system that’s simple and correct, but expensive if you don’t layer additional GPU-aware tooling on top.
The Three Ways to Share GPUs
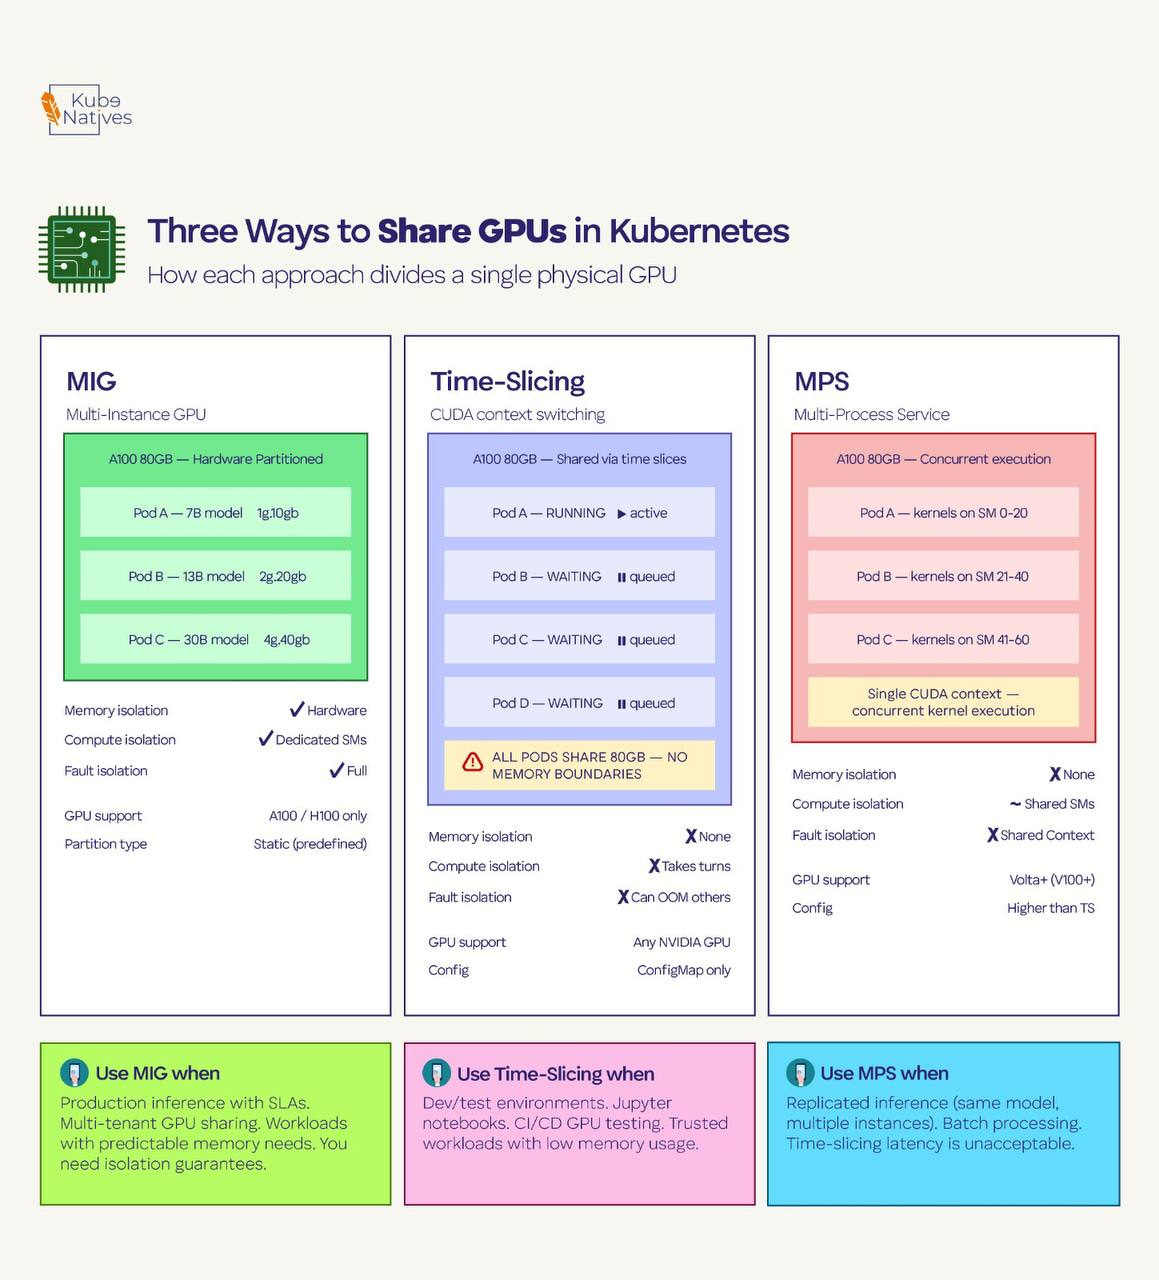
If you’re running inference workloads, dev environments, or any workload that doesn’t need the full physical GPU, you have three options. Each makes a different trade-off between isolation, utilization, and complexity.
Multi-Instance GPU (MIG)
MIG is hardware-level partitioning available on A100 and H100 GPUs. It physically divides a single GPU into up to seven isolated instances, each with its own dedicated memory, compute units, and cache.
These partitions are real hardware boundaries — one instance can’t access another’s memory, and a crash in one partition doesn’t affect the others.
When MIG is enabled, each partition appears as a separate resource type to Kubernetes. Instead of nvidia.com/gpu: 1, you request specific MIG profiles like nvidia.com/mig-1g.10gb: 1 (1 GPU compute slice with 10GB memory) or nvidia.com/mig-3g.40gb: 1 (3 slices with 40GB).
The good: True hardware isolation. Each partition has guaranteed memory and compute. One pod can’t OOM or starve another. You get SLA-grade isolation on shared hardware.
The bad: The partitioning is static — you configure MIG profiles on the physical GPU and they stay until you reconfigure. The profiles are predefined by NVIDIA; you can’t carve arbitrary sizes. And MIG only works on A100/H100 (not V100, T4, or consumer GPUs). Reconfiguring MIG profiles requires draining the GPU of all workloads first.
Use it when: You need production-grade isolation for inference workloads with predictable resource requirements. Multiple small models serving traffic on the same physical GPU. Multi-tenant clusters where teams don’t trust each other’s workloads.
Time-Slicing
Time-slicing is software-level GPU sharing configured through the NVIDIA GPU Operator. You tell the operator to advertise each physical GPU as multiple “replicas” — for example, 4 replicas per GPU. The scheduler then sees 4 allocatable GPUs instead of 1, and multiple pods share the physical GPU by taking turns on the compute hardware.
The sharing happens through CUDA’s built-in context switching. Each pod gets a time slice to run its CUDA kernels, then yields to the next pod. From the pod’s perspective, it has a full GPU. From the hardware’s perspective, it’s rapidly switching between workloads.
# GPU Operator time-slicing config
apiVersion: v1
kind: ConfigMap
metadata:
  name: time-slicing-config
  namespace: gpu-operator
data:
  any: |-
    version: v1
    sharing:
      timeSlicing:
        resources:
        - name: nvidia.com/gpu
          replicas: 4
The good: Works on any NVIDIA GPU. No hardware requirements. Simple to configure — just a ConfigMap. Great for maximizing utilization in dev/test environments.
The bad: Zero memory isolation. All time-sliced pods share the full GPU memory space. If one pod allocates 70GB on an 80GB GPU, the other three pods will OOM. There’s no mechanism to prevent this. Context switching also adds latency — each pod’s kernels get interrupted when another pod’s time slice begins.
Use it when: Dev environments, notebooks, CI/CD GPU testing, and any scenario where workloads are trusted and memory usage is predictable. Never use it for production inference with SLA requirements.
Multi-Process Service (MPS)
MPS is a CUDA-level feature that allows multiple processes to share a GPU simultaneously — not by taking turns (time-slicing), but by actually running kernels concurrently. MPS creates a single CUDA context that multiplexes multiple client processes, reducing context-switching overhead and allowing better SM utilization.
The good: Higher throughput than time-slicing because kernels from different processes can execute in parallel on different SMs. Lower latency because there’s no context switching. Better GPU utilization for workloads that individually underutilize compute resources.
The bad: Still no memory isolation — same risk as time-slicing where one process can consume all GPU memory. Limited error isolation: if one client process crashes, it can affect others sharing the MPS server. Less widely documented and tested in production K8s environments compared to MIG and time-slicing.
Use it when: High-throughput inference with multiple instances of the same model. Batch processing where workloads are homogeneous and trusted. Scenarios where time-slicing’s context-switching overhead is unacceptable but you can’t use MIG (wrong GPU generation, or you need more flexible partitioning).
The Decision Framework
Here’s how I think about it in production:
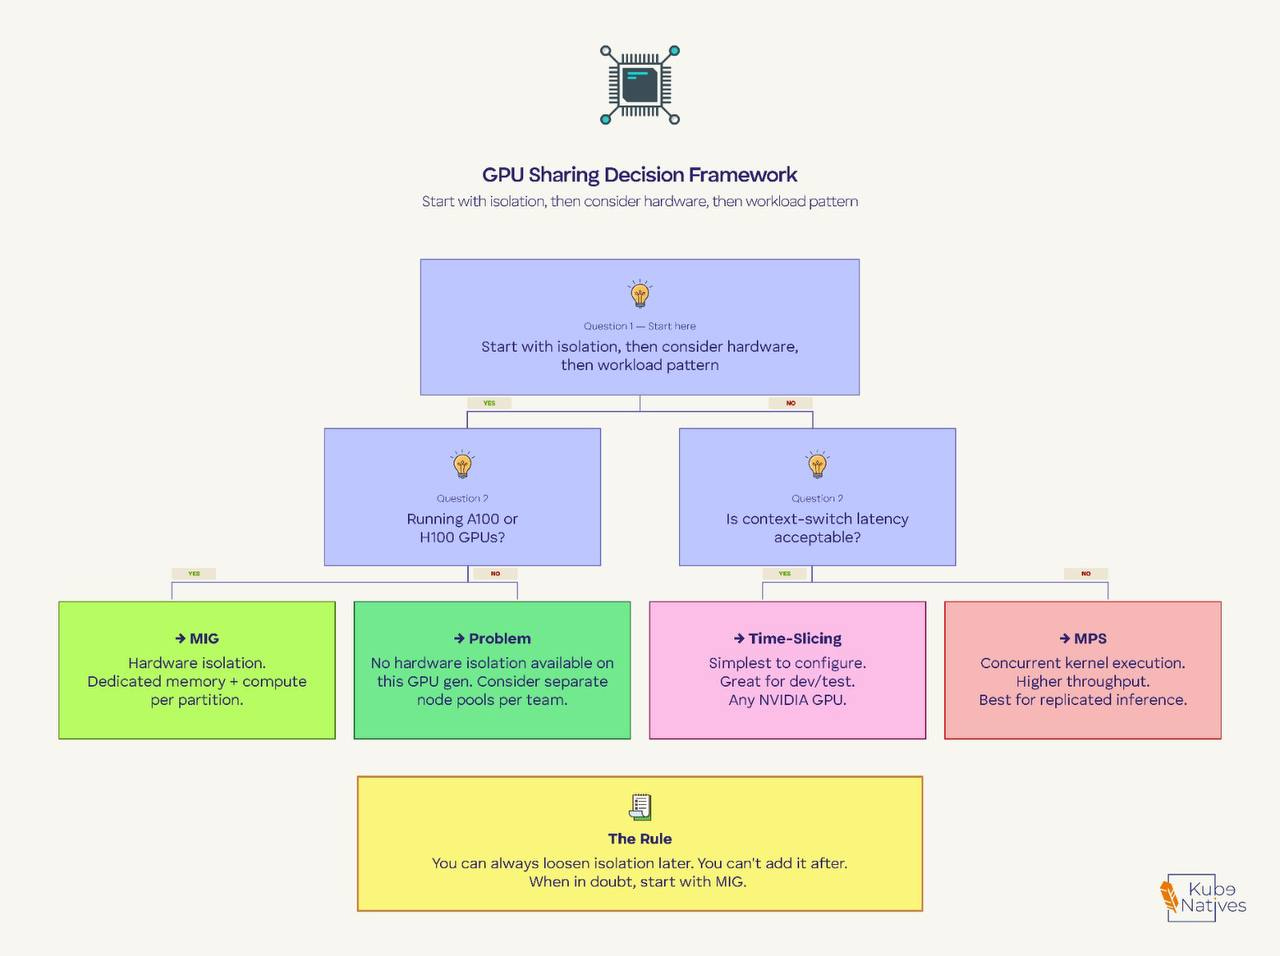
Start with the isolation question. If different teams or untrusted workloads share GPU nodes, you need MIG. There’s no way around this. Time-slicing and MPS give you no memory isolation — one misbehaving pod takes out everything else on that GPU.
Then consider the hardware. MIG only works on A100/H100. If you’re running T4s or V100s, your options are time-slicing or MPS. For T4-based inference nodes, time-slicing with 2-4 replicas is the most common production pattern.
Then look at the workload pattern. If you’re running the same model multiple times for throughput (replicated inference), MPS gives you better performance than time-slicing. If you’re running diverse workloads with different memory footprints, MIG gives you the cleanest separation.
The rule I follow: You can always loosen isolation later. You can’t add it after. Start with MIG if your hardware supports it. Move to time-slicing only for dev/test, and MPS only when you’ve benchmarked it against your specific workloads.
The Part Nobody Tells You: The GPU Operator Stack
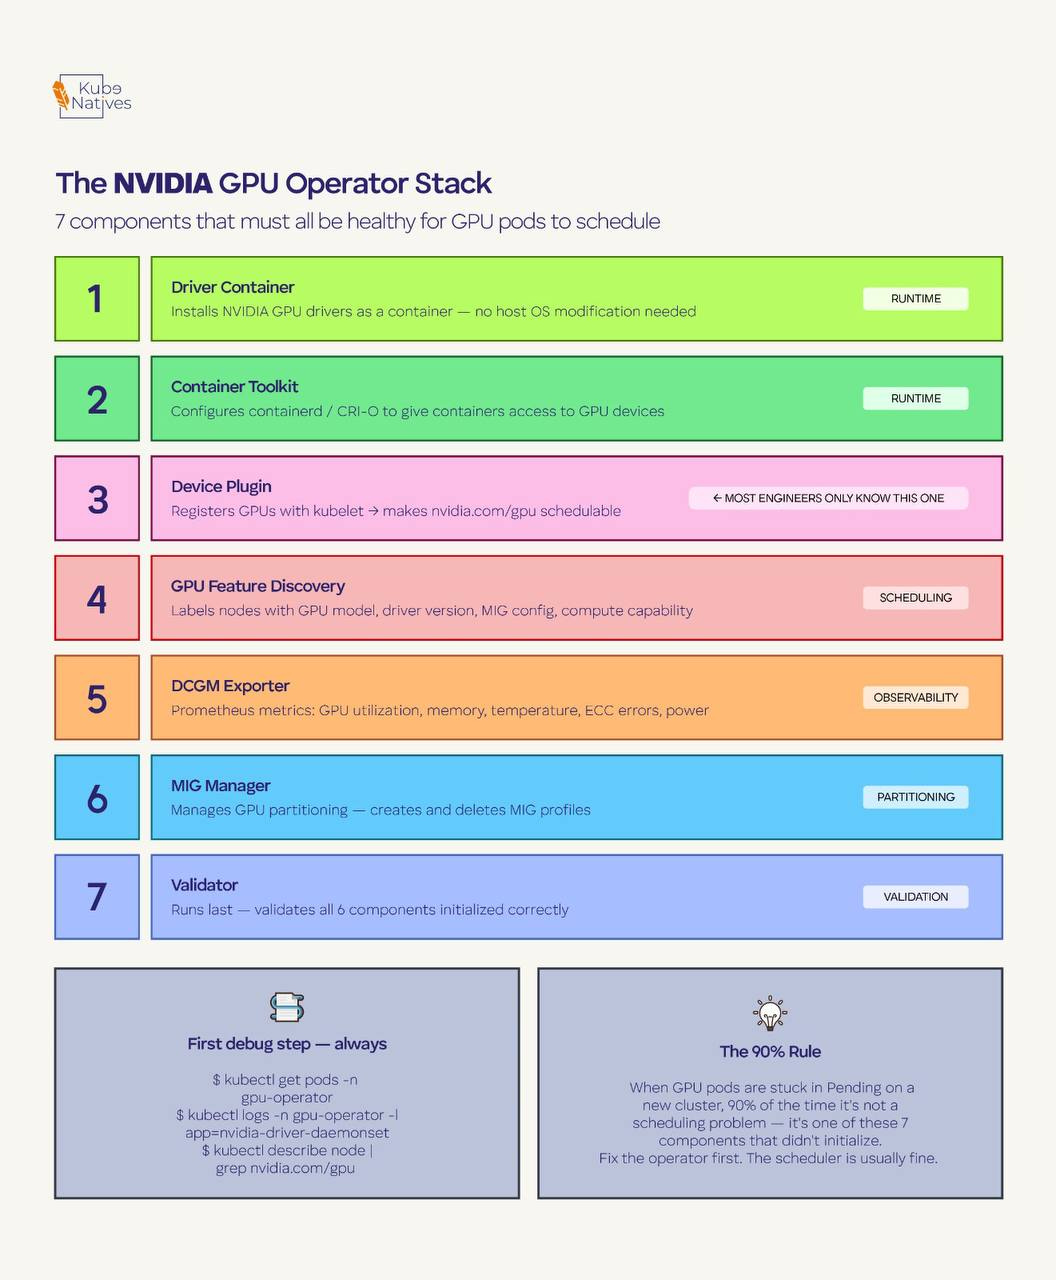
None of this works unless the NVIDIA GPU Operator is healthy. The operator installs seven components on every GPU node, and most engineers only know about one of them (the device plugin).
Here’s what each component does:
Driver Container — Installs NVIDIA GPU drivers as a container instead of directly on the host OS. This is why you don’t need to manage driver versions across your fleet manually.
Container Toolkit — Configures the container runtime (containerd/CRI-O) to give containers access to GPU devices. Without this, your containers can’t see the GPU even if the drivers are installed.
Device Plugin — The component most people know. Registers GPUs with the kubelet so the scheduler can allocate them. This is what makes
nvidia.com/gpuappear as a schedulable resource.GPU Feature Discovery (GFD) — Automatically labels nodes with GPU metadata: model name, driver version, CUDA version, MIG configuration, compute capability. These labels are what allow you to use
nodeSelectorto target specific GPU types.DCGM Exporter — Exports GPU metrics to Prometheus: utilization, memory usage, temperature, ECC errors, power draw. This is your GPU observability layer.
MIG Manager — Handles GPU partitioning for MIG. Manages MIG profile creation and deletion. Only active when MIG is enabled.
Validator — Runs after all other components and validates that everything initialized correctly. If the validator pod isn’t Running, something upstream failed.
When GPU pods get stuck in Pending, the reflex is to check the scheduler or node capacity. But 90% of the time in a freshly configured cluster, the real problem is one of these seven components that didn’t initialize.
First debug step, always:
kubectl get pods -n gpu-operator
If any pod isn’t Running, that’s your problem. Fix the operator component first. The scheduler is usually fine.
What’s Coming Next: Dynamic Resource Allocation
The binary integer model is changing. Kubernetes 1.34 graduated Dynamic Resource Allocation (DRA) to GA, enabled by default.
DRA replaces the device plugin’s simple count-based model with structured parameters that let you request GPUs by specific attributes — memory size, compute capability, topology position.
Instead of nvidia.com/gpu: 1 and hoping you get the right one, you’ll be able to express claims like “give me a GPU with at least 40GB memory on the same NUMA node as my CPU allocation.”
NVIDIA’s GPU Operator is already moving to the Container Device Interface (CDI) as the default device injection method, aligning with this DRA-based future. And NVIDIA’s open-sourced KAI Scheduler adds topology-aware scheduling, gang scheduling, and hierarchical queues on top — features the default K8s scheduler doesn’t have.
This is worth watching. The GPU scheduling landscape a year from now will look very different from today.
Key Takeaway
Kubernetes sees GPUs as integers. The scheduler allocates whole devices with zero awareness of memory or compute utilization. This is by design, not a bug — but it means GPU efficiency is your problem, not the scheduler’s.
MIG, time-slicing, and MPS are the three tools to solve it, and the right choice depends on isolation requirements first, hardware second, workload patterns third.
If you’re running ML workloads on Kubernetes, subscribe to KubeNatives for weekly deep-dives on GPU infrastructure, model serving, and production K8s operations.
Really good article, very easy to understand. Thanks!