
API Server Latency: What Is Normal and What Is a Red Flag
Your API server p99 is 400ms. Is that fine or is the cluster about to fall over? Here are the numbers that matter and what to do when they go wrong.

Every Kubernetes operation goes through the API server. kubectl commands, controller reconciliation loops, kubelet heartbeats, webhook calls, custom operators. Thousands of requests per minute on a busy cluster.
When the API server slows down, everything slows down. Deployments stall. Pods stay in Pending longer. Controllers fall behind their desired state. The cluster feels sluggish even though CPU and memory on the nodes look fine.
The hard part is knowing when slow is slow. A 200ms p99 on a list operation is great. A 200ms p99 on a GET pod call is a fire.
This article covers the latency numbers that matter, the thresholds that signal trouble, and the 4 most common causes of API server latency spikes.
The Metric That Matters: apiserver_request_duration_seconds
The API server exposes request latency as a Prometheus histogram broken down by verb, resource, and scope. The raw metric name is apiserver_request_duration_seconds.
You never look at the average. You look at p99 by verb and resource.
A single cluster can have hundreds of different verb plus resource combinations. The ones that matter in practice are small in number. Focus on these.
# GET requests on individual objects
histogram_quantile(0.99,
  sum by (le, resource) (
    rate(apiserver_request_duration_seconds_bucket{verb="GET"}[5m])
  )
)

# LIST requests (the ones most likely to be slow)
histogram_quantile(0.99,
  sum by (le, resource) (
    rate(apiserver_request_duration_seconds_bucket{verb="LIST"}[5m])
  )
)

# WATCH requests (should be near zero latency after setup)
histogram_quantile(0.99,
  sum by (le, resource) (
    rate(apiserver_request_duration_seconds_bucket{verb="WATCH"}[5m])
  )
)
Three verbs. Three different expectations. Treating them the same is why most teams get API server alerting wrong.
What Normal Looks Like
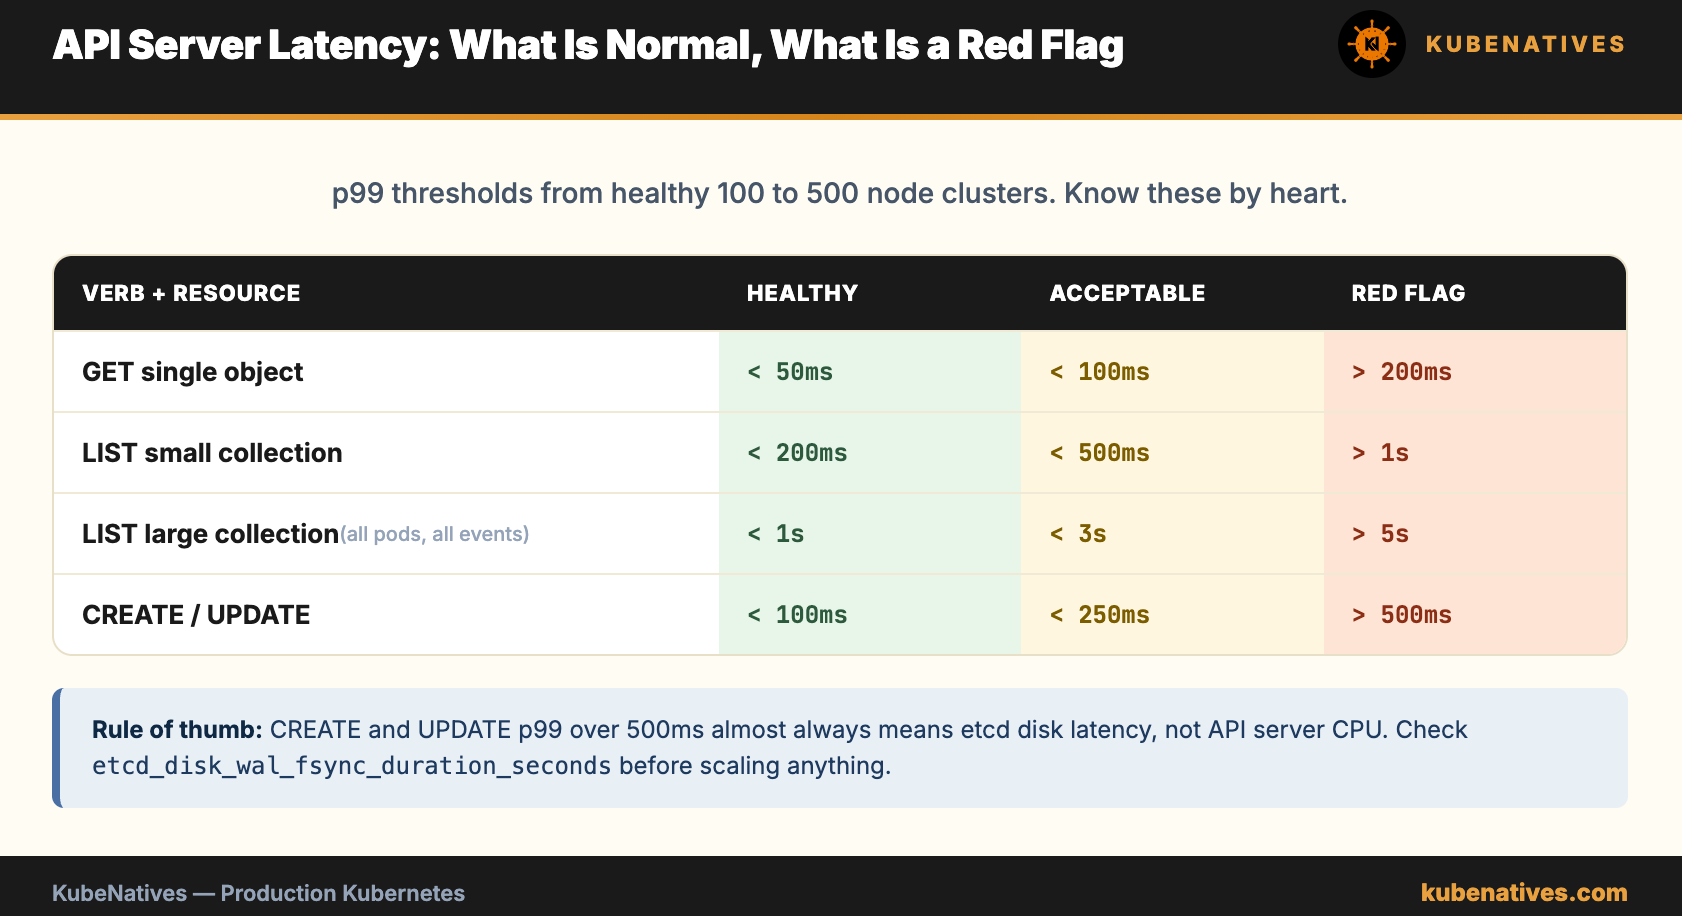
The thresholds below are production numbers from healthy clusters in the 100 to 500 node range. Smaller clusters run faster. Larger clusters with heavy CRD usage run slower. Use these as a starting point and adjust for your baseline.
GET on individual objects: p99 under 50ms is healthy. Under 100ms is acceptable. Over 200ms means something is wrong.
LIST on small collections (under 1000 objects): p99 under 200ms is healthy. Under 500ms is acceptable. Over 1s is a problem.
LIST on large collections (pods across all namespaces, all events): p99 under 1s is healthy. Under 3s is acceptable. Over 5s means etcd or pagination is broken.
CREATE and UPDATE: p99 under 100ms is healthy. Under 250ms is acceptable. Over 500ms usually means etcd write latency, not API server CPU.
WATCH: the duration metric is misleading for watches. They are long lived. Look at apiserver_current_inflight_requests and etcd_server_has_leader instead.
Memorize the shape of these numbers. When you hit an incident at 3 AM, you need to know if 400ms on LIST pods is normal or is the alarm.
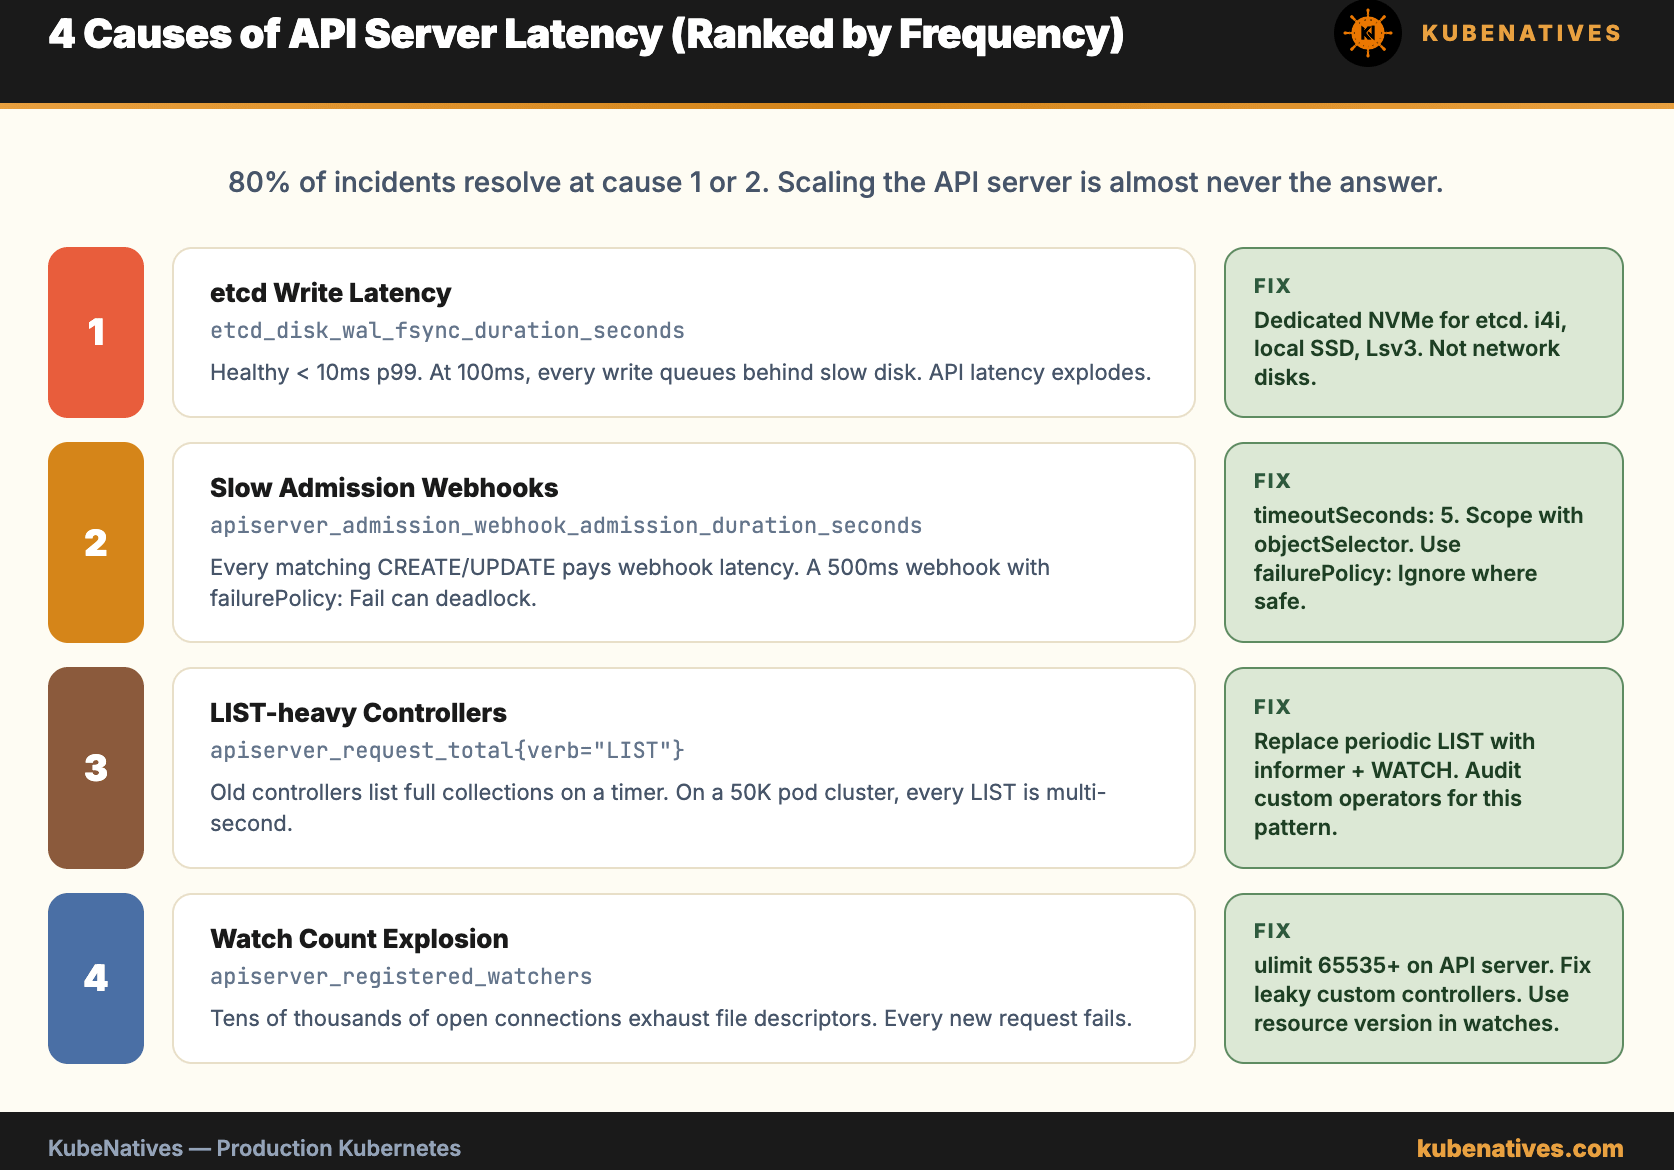
Cause 1: etcd Write Latency
The API server is stateless. Every write it accepts must be committed to etcd before the API server returns success. If etcd is slow, the API server is slow. No amount of API server scaling fixes this.
The metric to check: etcd_disk_wal_fsync_duration_seconds.
Healthy etcd: p99 under 10ms. Warning: p99 between 10ms and 50ms. Broken: p99 over 50ms.
When fsync hits 100ms, every write operation on the API server gets queued behind a slow disk. p99 API latency explodes.
The fix: dedicated NVMe storage for etcd. Not network attached disks. Not shared storage. Local NVMe on the etcd nodes. This is the single biggest performance improvement available.
If you are on a cloud provider, use the fastest local instance storage option. On AWS that is i4i or im4gn instances. On GCP that is local SSD. On Azure that is Lsv3 series.
Cause 2: List Operations Against Huge Collections
A controller that lists all pods across all namespaces every 30 seconds is a common cause of API server pressure. Each list pulls the full object from etcd through the API server, serializes it, and ships it to the controller.
On a 500 pod cluster, this is fine. On a 50,000 pod cluster, every list takes several seconds and consumes significant API server CPU.
The metrics to watch:
apiserver_request_total broken down by verb, resource, and subresource. Look for verb=”LIST” counts that dominate the total.
apiserver_response_sizes_bucket shows the size of responses. If LIST pods is returning 50MB responses on every call, you have a problem.
The fix: use label selectors, field selectors, and watch with resource version instead of periodic lists. Every Kubernetes controller written in the last 5 years uses informers that watch and cache rather than list. Audit your custom operators and any home grown controllers. The old pattern of periodic list is what kills clusters.
Cause 3: Admission Webhooks
Every create and update request passes through admission webhooks. Policy controllers, sidecar injectors, mutating webhooks for secrets. A slow webhook adds its latency to every matching request.
A 500ms webhook with failurePolicy: Fail is not just slow. It can deadlock cluster operations. If the webhook pod is down, no pods can be created. Including the webhook pod itself.
The metric: apiserver_admission_webhook_request_total and apiserver_admission_webhook_rejection_count.
The better metric for latency: apiserver_admission_webhook_admission_duration_seconds.
Healthy webhooks run under 100ms p99. Anything over 1s is a production risk.
The fix: set timeoutSeconds: 5 on every webhook at most. Use failurePolicy: Ignore for non critical webhooks. Scope webhooks with objectSelector and namespaceSelector so they only fire on the objects that actually need them. Default webhook scope is everything, which means every single create passes through.
Cause 4: Too Many Watches
The API server holds open connections for every watch client. Controllers, kubelet, custom operators, kubectl commands with watch mode. A single kubelet holds multiple watches.
On large clusters, watch count can reach tens of thousands of concurrent connections. Each one consumes memory and a file descriptor.
The metric: apiserver_registered_watchers broken down by resource.
When watch count spikes, the API server runs out of file descriptors. Every new connection fails. Latency explodes on everything.
The fix: set ulimits on the API server to at least 65535. Use watch with resource version and compaction to reduce memory pressure. Audit custom operators for watches that are never closed. Watch leaks are a real problem in handwritten controllers.
The Alert Set That Catches Real Problems
Most teams alert on p99 latency thresholds and nothing else. That catches slow symptoms, not slow causes.
A good alert set has 4 rules:
# 1. API server latency itself
- alert: APIServerHighLatency
  expr: histogram_quantile(0.99,
    sum by (le, verb) (
      rate(apiserver_request_duration_seconds_bucket{verb!="WATCH"}[5m])
    )
  ) > 1
  for: 5m

# 2. etcd disk latency (leading indicator)
- alert: EtcdSlowDisk
  expr: histogram_quantile(0.99,
    rate(etcd_disk_wal_fsync_duration_seconds_bucket[5m])
  ) > 0.05
  for: 5m

# 3. Webhook latency
- alert: SlowAdmissionWebhook
  expr: histogram_quantile(0.99,
    sum by (le, name) (
      rate(apiserver_admission_webhook_admission_duration_seconds_bucket[5m])
    )
  ) > 1
  for: 5m

# 4. Watch count spike
- alert: TooManyWatchers
  expr: sum(apiserver_registered_watchers) > 50000
  for: 15m
Rule 1 tells you there is a problem. Rules 2, 3, and 4 tell you what the problem is. Without the leading indicators, you wake up at 3 AM to a slow cluster and no idea where to look.
The Debugging Flow
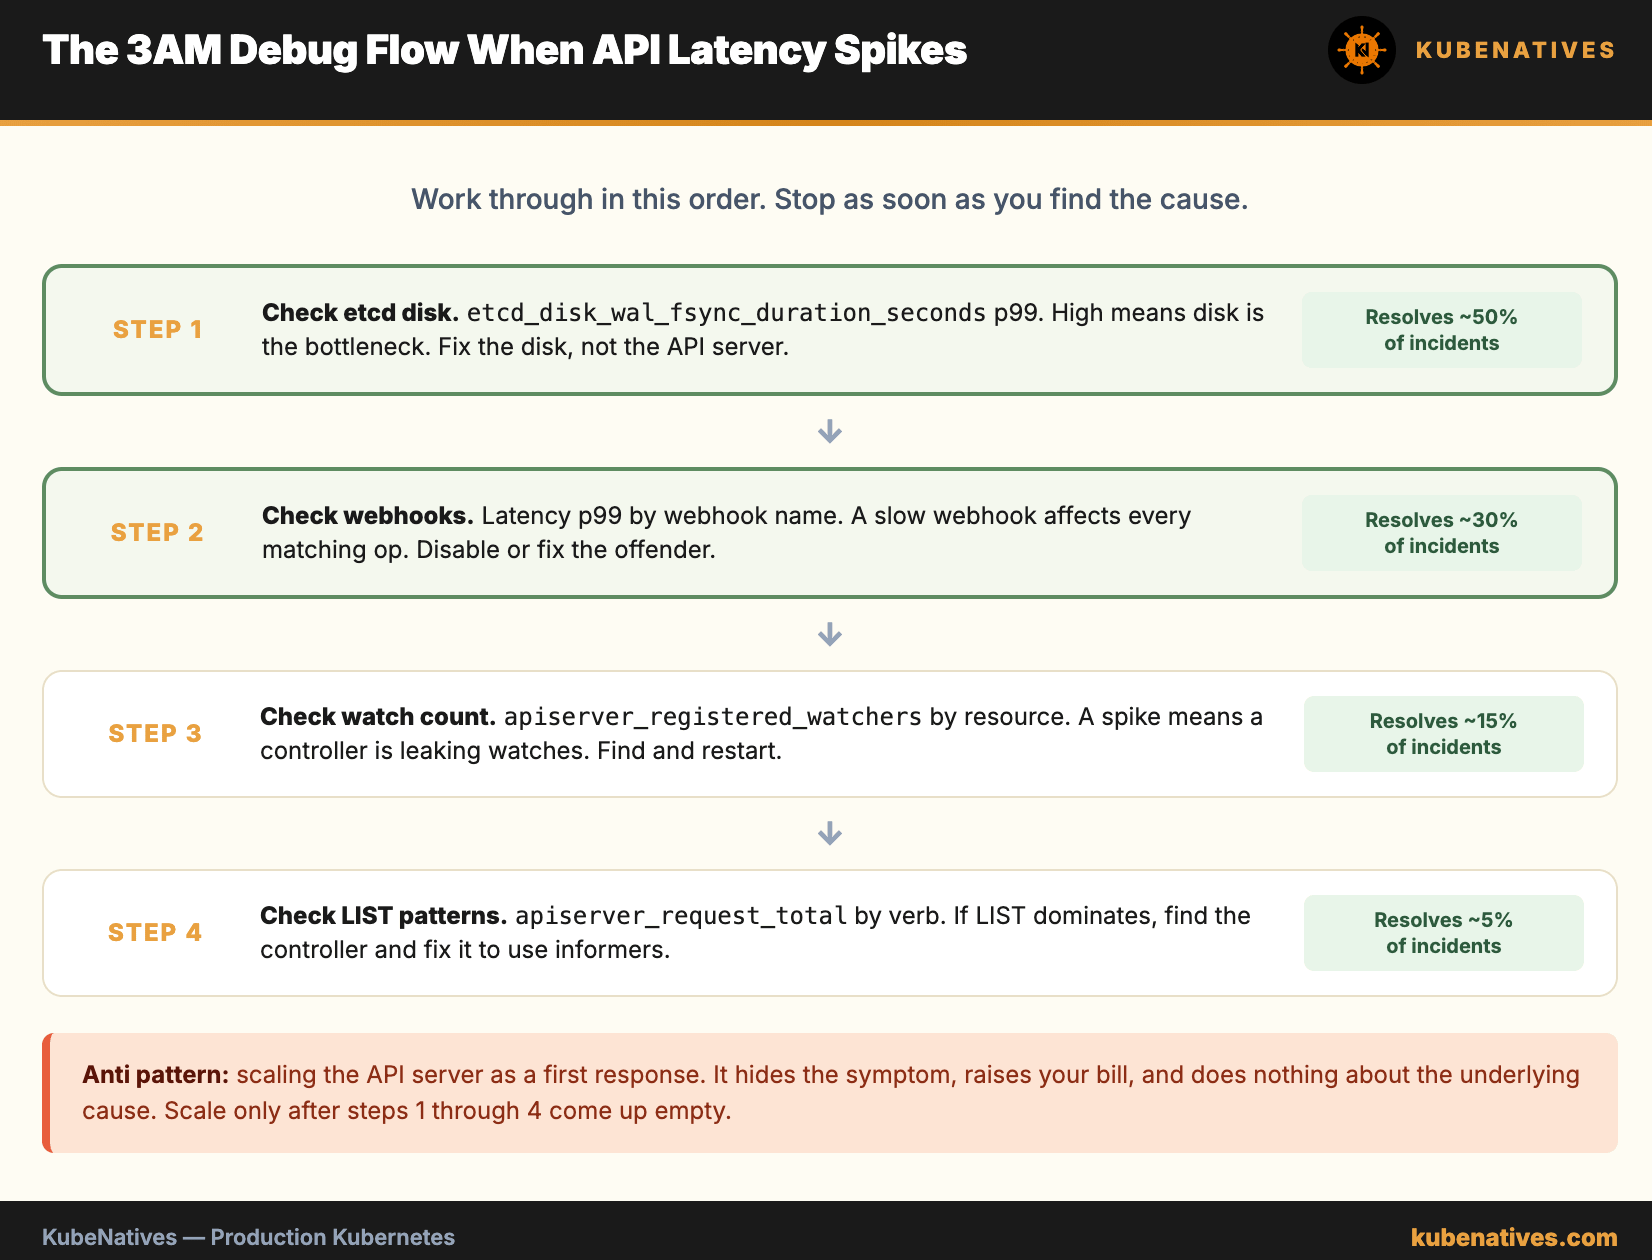
When the API server gets slow in production, work through the causes in order of likelihood.
Step 1: check etcd. etcd_disk_wal_fsync_duration_seconds p99. If it is high, the problem is disk. Fix the disk or move etcd to external NVMe nodes.
Step 2: check webhooks. apiserver_admission_webhook_admission_duration_seconds p99 by webhook name. A slow webhook affects every matching operation. Disable or fix the slow one.
Step 3: check watch count. apiserver_registered_watchers by resource. A spike means a controller is leaking watches.
Step 4: check list patterns. apiserver_request_total by verb. If LIST is dominating, find the controller doing it and fix it to use informers.
80% of API server slowness resolves at step 1 or step 2. Do not start by scaling the API server. Scaling hides the symptom and makes the bill worse.
The Bottom Line
API server latency is the health signal for the entire control plane. Everything flows through it, so it sees every problem first.
Know the normal numbers. p99 under 50ms on GET, under 200ms on LIST for small collections, under 1s on LIST for large ones. Alert on etcd disk latency, webhook latency, and watch count. Investigate those before you investigate the API server itself.
And if you take one thing away: etcd on NVMe. The single highest leverage change you can make for API server performance on a busy cluster.
Next week: A/B Testing LLM Models in Production with Kubernetes.
If you are running production Kubernetes clusters, I cover control plane internals, GPU infrastructure, and model serving every week. Subscribe at kubenatives.com.