
What Actually Happens Inside the Kubernetes Control Plane
What every production engineer should understand about the API server, etcd, scheduler, and controller manager, and why it matters when things break at 3 AM.

Your cluster is slow. Pods take 30 seconds to schedule instead of 3. You restart the API server, and it gets worse.
The problem isn’t your application. It’s your control plane, and most engineers have never looked inside it.
Every “Introduction to Kubernetes” article explains the control plane the same way: a box diagram with four components and some arrows. That’s fine for certification exams.
It’s useless when your production cluster is degraded, and you need to find the bottleneck in the next five minutes.
This article is different. We’ll walk through what each component actually does, what the request flow looks like step by step, and, more importantly, what breaks in production and how to see it coming.
The One-Sentence Mental Model
The control plane is a distributed system that continuously compares “what you asked for” with “what currently exists” and takes action to close the gap.
That’s it. Every component in the control plane serves this reconciliation loop. Once you understand that, the architecture stops being a box diagram and starts being a debuggable system.
The 4 Components
API Server (kube-apiserver) — The front door. Every request from kubectl, from controllers, from the kubelet goes through the API server.
It’s a RESTful API that authenticates, authorizes, validates, and writes objects to etcd. It does not schedule pods. It does not manage containers.
It does not run your workloads. It processes API requests. That’s its entire job.
etcd — The database. Every object you’ve ever created in the cluster pods, services, configmaps, secrets, and deployments lives here as key-value pairs.
etcd is the only stateful component in the control plane and the single source of truth for the entire cluster.
If etcd is gone, your cluster is gone.
Scheduler (kube-scheduler) — The matchmaker. It watches the API server for pods that have no spec.nodeName (meaning they haven’t been assigned to a node yet).
For each unscheduled pod, it scores available nodes based on resource availability, taints, tolerations, affinity rules, and topology constraints.
When it finds the best node, it writes the assignment back to the API server, which stores it in etcd.
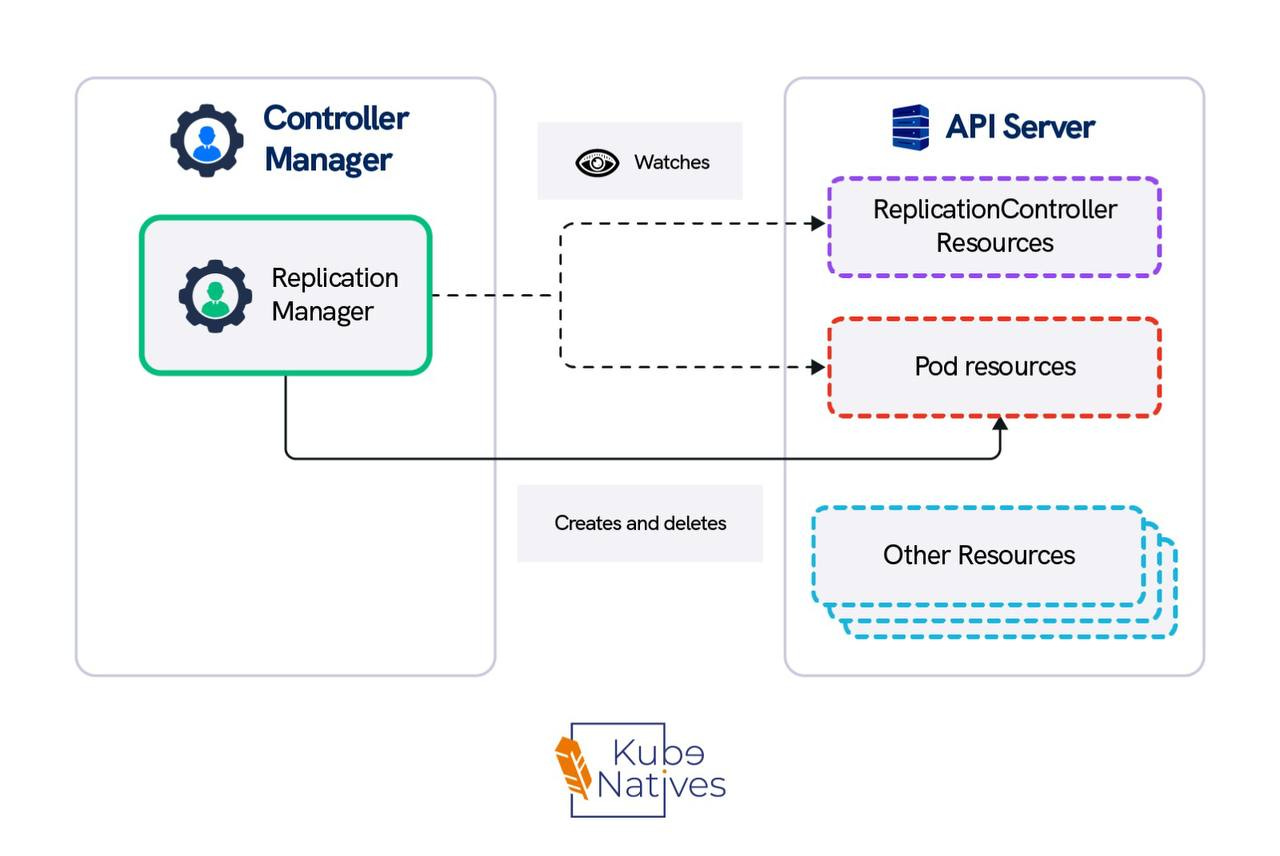
Controller Manager (kube-controller-manager) — The reconciliation engine. It runs approximately 30 separate control loops. The ReplicaSet controller ensures pod counts match the desired state.
The Deployment controller manages rollouts. The Node controller detects unhealthy nodes. Each controller watches the API server for changes and takes corrective action when the actual state drifts from the desired state.
What Happens When You Run kubectl apply
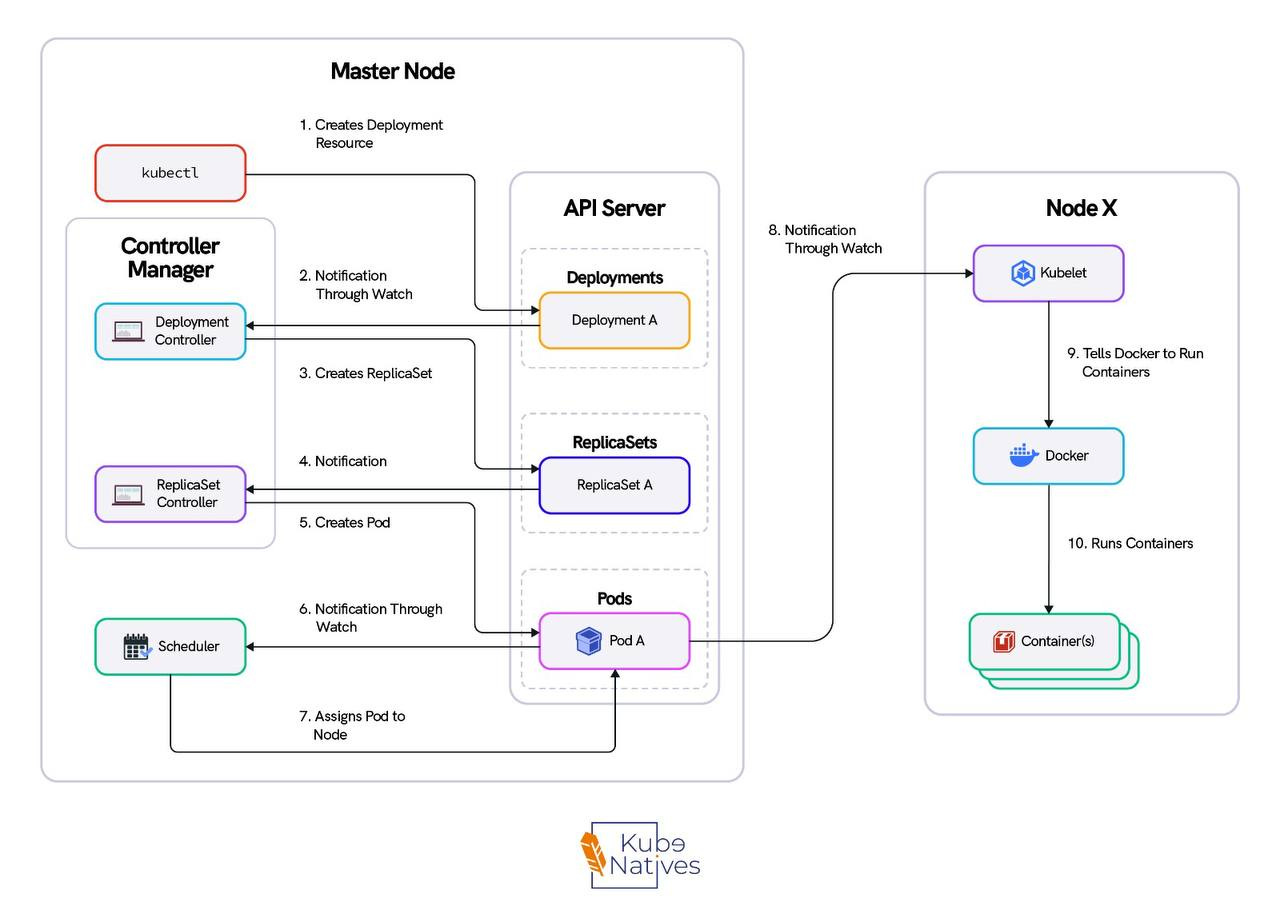
This is the flow. Memorize it — it’s how you’ll debug every control plane issue you ever encounter.
Step 1: kubectl sends an HTTP POST to the API server. kubectl is nothing more than an HTTP client. It reads your kubeconfig, authenticates, and sends a payload.
Step 2: The API server runs the request through four gates:
• Authentication — Who are you? (certificate, token, or OIDC)
• Authorization — Can you do this? (RBAC check)
• Admission Controllers — Should this be allowed? (webhooks, resource quotas, pod security)
• Validation — Is this object well-formed?
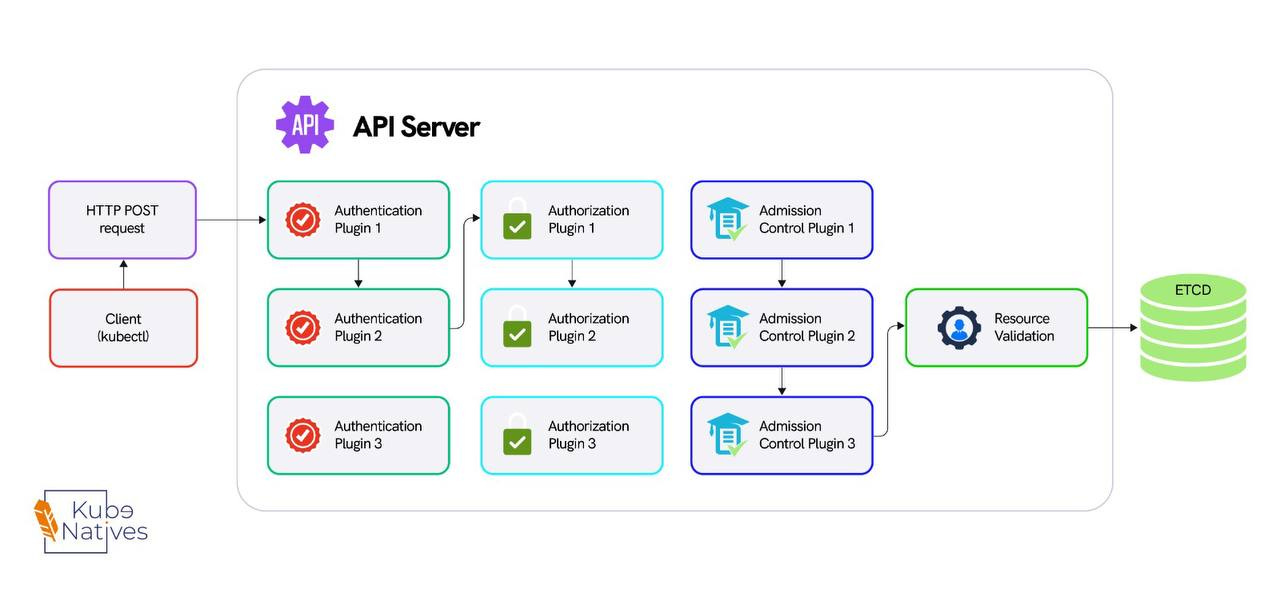
Only after all four gates pass does the object move forward.
Step 3: The API server writes the validated object to etcd. etcd runs Raft consensus — the write needs agreement from a majority of etcd members (2 out of 3 in a typical cluster) before it’s committed.
Step 4: The scheduler is watching the API server via a persistent HTTP connection. It sees the new pod, notices it has no spec.nodeName, scores the available nodes, and writes the node assignment back to the API server, which writes it to etcd.
Step 5: The kubelet on the assigned worker node is also watching the API server. It sees the pod assigned to its node, pulls the container image, creates the pod sandbox, and starts the container.
Step 6: The controller manager is watching pod status through the API server. If the pod crashes, the ReplicaSet controller notices the actual count doesn’t match the desired count and creates a replacement, starting the cycle again.
Notice the pattern: no component talks to another directly. The scheduler doesn’t talk to the kubelet. The controller manager doesn’t talk to etcd. Everything flows through the API server. This is the single most important thing to understand about the control plane.
API server health = cluster health.
What Breaks in Production
Every other control plane article stops at the architecture diagram. This is where it actually gets useful.
The API Server Bottleneck
The API server is stateless — you can run multiple replicas behind a load balancer. But it’s the chokepoint for every single operation in the cluster.
In a cluster with 500+ nodes, the API server is handling thousands of persistent watch connections simultaneously. Every kubelet watches for pod assignments.
Every controller watches for state changes. Every operator watches for custom resources. That’s thousands of open HTTP connections maintained concurrently.
We saw API server latency spike to 5 seconds during a deployment rollout across 200 nodes. The immediate assumption was CPU saturation or memory pressure. It was neither.
The problem was file descriptors. Every watch connection requires a file descriptor on the API server. The default ulimit -n on the nodes was set to 1024.
During the rollout, the burst of new watch events and API calls pushed past the limit. New connections were being dropped, causing clients to retry, which made it worse.
The fix was one line: increasing the file descriptor limit on the API server nodes. Not more CPU. Not more memory. Not more replicas. File descriptors.
This is why you need to understand the architecture — so you know where to look.
etcd — The Silent Killer
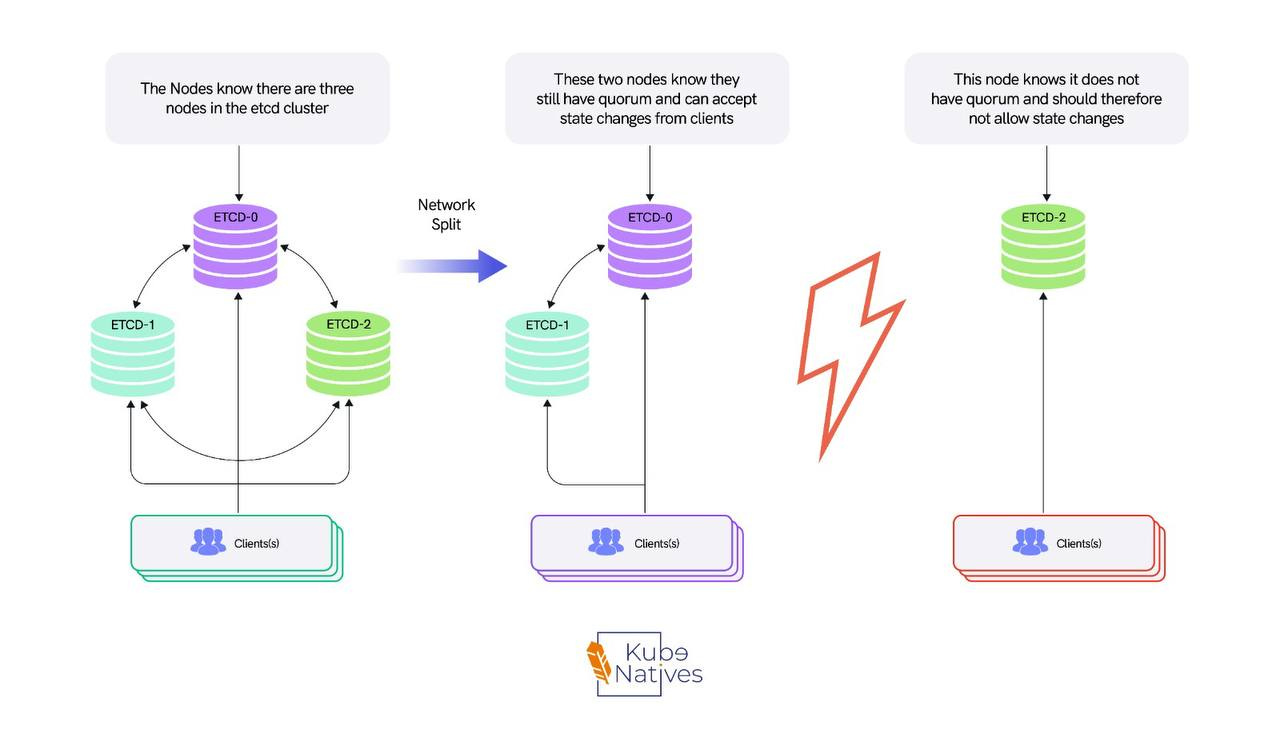
etcd is the most critical and least understood component in the control plane. It’s a distributed key-value store running Raft consensus.
Every write needs majority agreement from the cluster members before it’s committed. In a 3-node etcd cluster, that’s 2 out of 3.
This means etcd performance is directly tied to two things: disk I/O latency (how fast etcd can fsync the write-ahead log to disk) and network latency between etcd members (how fast they can reach consensus).
The most common production mistake is stacked etcd — the default kubeadm configuration where etcd runs on the same nodes as the API server, scheduler, and controller manager.
Under normal load, this works fine. Under heavy load, etcd and the API server compete for disk I/O. etcd writes get slower, which makes API server responses slower, which causes more retries, which causes more writes to etcd.
It’s a feedback loop that degrades gradually until it doesn’t — and then everything fails at once.
We moved to external etcd on dedicated nodes with NVMe storage. API server p99 latency dropped 40%. The cluster went from periodic latency spikes during deployments to flat, predictable performance.
I’ll be writing a full deep-dive on stacked vs. external etcd topologies in a future issue, including the exact setup, the trade-offs, and when stacked etcd is actually fine.
Scheduler Performance at Scale
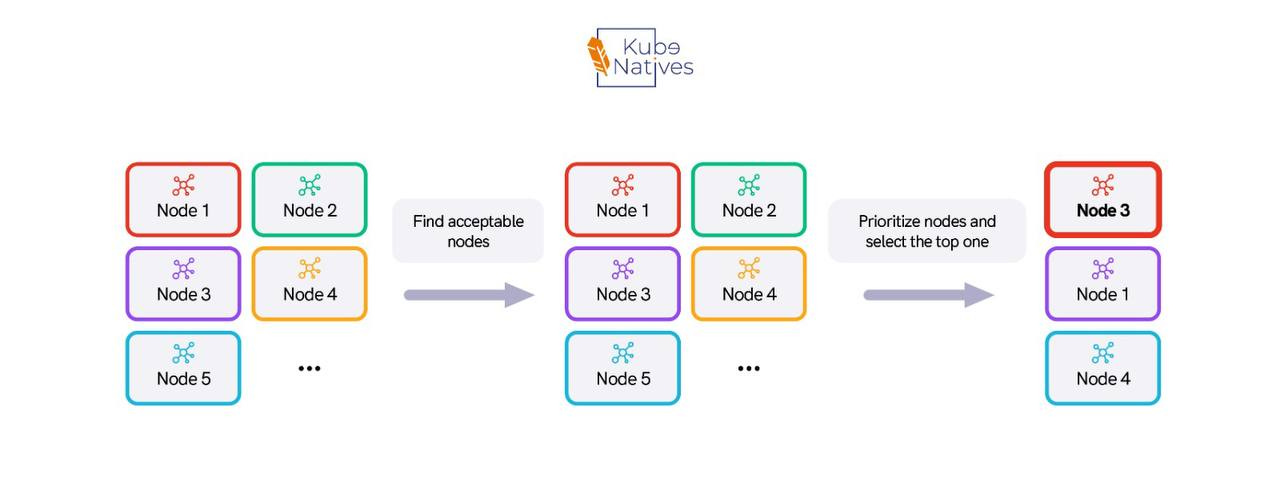
The scheduler runs a scoring algorithm on every available node for every unscheduled pod. With simple workloads and small clusters, this is fast sub-second. But complexity adds up.
When you add pod anti-affinity rules, topology spread constraints, node affinity, and custom scheduling plugins, the scoring function gets expensive.
In a cluster with 1000+ nodes and pod anti-affinity rules, we measured scheduling latency at 8-12 seconds per pod.
For most workloads, that’s unacceptable. The fix was percentageOfNodesToScore a scheduler configuration that limits how many nodes the scheduler evaluates before making a decision.
The default is 50% of nodes for large clusters. We dropped it to 10%.
The result: scheduling latency went from 8-12 seconds to under 1 second. The placement wasn’t theoretically optimal anymore, but it was good enough and for production workloads, fast scheduling beats perfect scheduling every time.
Controller Manager Thundering Herd
When a node goes down, the node controller marks all pods on that node for deletion. If that node was running 50 pods, the controller manager creates 50 replacement pods simultaneously.
The scheduler then has to score and place all 50 pods. The API server has to process 50 writes. etcd has to replicate 50 entries across its cluster.
This cascade is why large node failures can temporarily destabilize the entire control plane. Every component is suddenly handling a burst of work that’s 50x its normal steady-state load.
The mitigation is rate limiting on the controller manager. The flags --kube-api-burst and --kube-api-qps control how fast the controller manager can make API calls. Setting these appropriately prevents the controller manager from overwhelming the API server during recovery.
It’s counterintuitive you’re deliberately slowing down recovery. But a slightly slower, stable recovery is better than a fast recovery that cascades into a control plane outage.
The Metrics That Actually Matter
Most teams monitor CPU and memory on control plane nodes. That’s necessary but not sufficient. These are the metrics that actually predict control plane problems before they become incidents:
etcd_disk_wal_fsync_duration_seconds — How long etcd takes to sync its write-ahead log to disk. If this consistently exceeds 10ms, your etcd is struggling and you’ll start seeing elevated API server latency. This is the single best early-warning metric for control-plane degradation.
apiserver_request_duration_seconds — API server latency broken down by verb: GET, LIST, WATCH, POST, DELETE.
If LIST operations are slow, you have too many objects (consider pagination or pruning).
If WATCH is slow, you have too many watchers. If POST is slow, etcd writes are bottlenecked.
Check this directly:
kubectl get --raw /metrics | grep apiserver_request_durationscheduler_scheduling_attempt_duration_seconds — How long the scheduler takes to place a pod.
If this is creeping up, your scheduling rules are getting too complex or your cluster has grown past the point where scoring all nodes is feasible.
etcd_server_leader_changes_seen_total — Leader elections in etcd mean instability.
One leader change occasionally is fine. More than one per hour means something is wrong — likely network issues between etcd members or disk I/O contention.
The Key Takeaway
The control plane consists of 4 components and 1 rule: everything goes through the API server.
When your cluster is slow, don’t restart things. Trace the request path and find the bottleneck.
Is the API server overloaded?
Is etcd slow on disk?
Is the scheduler scoring too many nodes?
Is the controller manager creating a thundering herd?
The architecture tells you where to look. The metrics tell you what’s wrong.
Next week: How Kubernetes schedules GPU workloads — and why the default scheduler treats your $30K A100 like a boolean. If you’re running ML inference on Kubernetes, that one’s for you.
If you found this useful, share it with an engineer who’s ever restarted an API server at 3 AM without knowing why it was slow.