
MIG vs Time-Slicing vs MPS: Which GPU Sharing Strategy and When
Your $30K GPU is “fully allocated” at 10% utilization. These three strategies fix that. They work completely differently.

You requested nvidia.com/gpu: 1 for a 7B model that uses 8GB of VRAM.
Kubernetes gave it an entire A100 with 80GB. The device plugin reported the GPU as fully allocated. Your next pod is stuck in Pending because the scheduler sees zero GPUs available.
This is the fundamental problem with GPU scheduling in Kubernetes. The default device plugin treats GPUs as indivisible integers. One GPU, one pod. No sharing. No fractional allocation. No memory awareness.
We covered why this happens in our GPU scheduling deep dive. This article goes deeper on the three strategies that fix it.
Multi-Instance GPU (MIG). Time-Slicing. Multi-Process Service (MPS).
Each one works at a different level of the stack. Each one provides different isolation guarantees. Each one is the right choice for different workloads.
What the Default Device Plugin Actually Does
The NVIDIA device plugin runs as a DaemonSet on every GPU node. It discovers the physical GPUs, registers them with the kubelet as extended resources (nvidia.com/gpu), and assigns them to pods.
The key limitation is that extended resources in Kubernetes only support integers. You can request nvidia.com/gpu: 1 or nvidia.com/gpu: 2. You cannot request nvidia.com/gpu: 0.5. Fractional GPUs do not exist at the scheduler level.
When a pod requests 1 GPU, the device plugin assigns the entire physical GPU. All memory. All compute cores. All memory bandwidth. Nobody else can use that GPU until the pod releases it.
For a 70B model using 75GB of an 80GB A100, this makes sense. For a 7B model using 8GB, you just wasted $25K worth of GPU capacity.
The three sharing strategies all make a single physical GPU appear as multiple resources to the device plugin. But they do it at completely different layers.
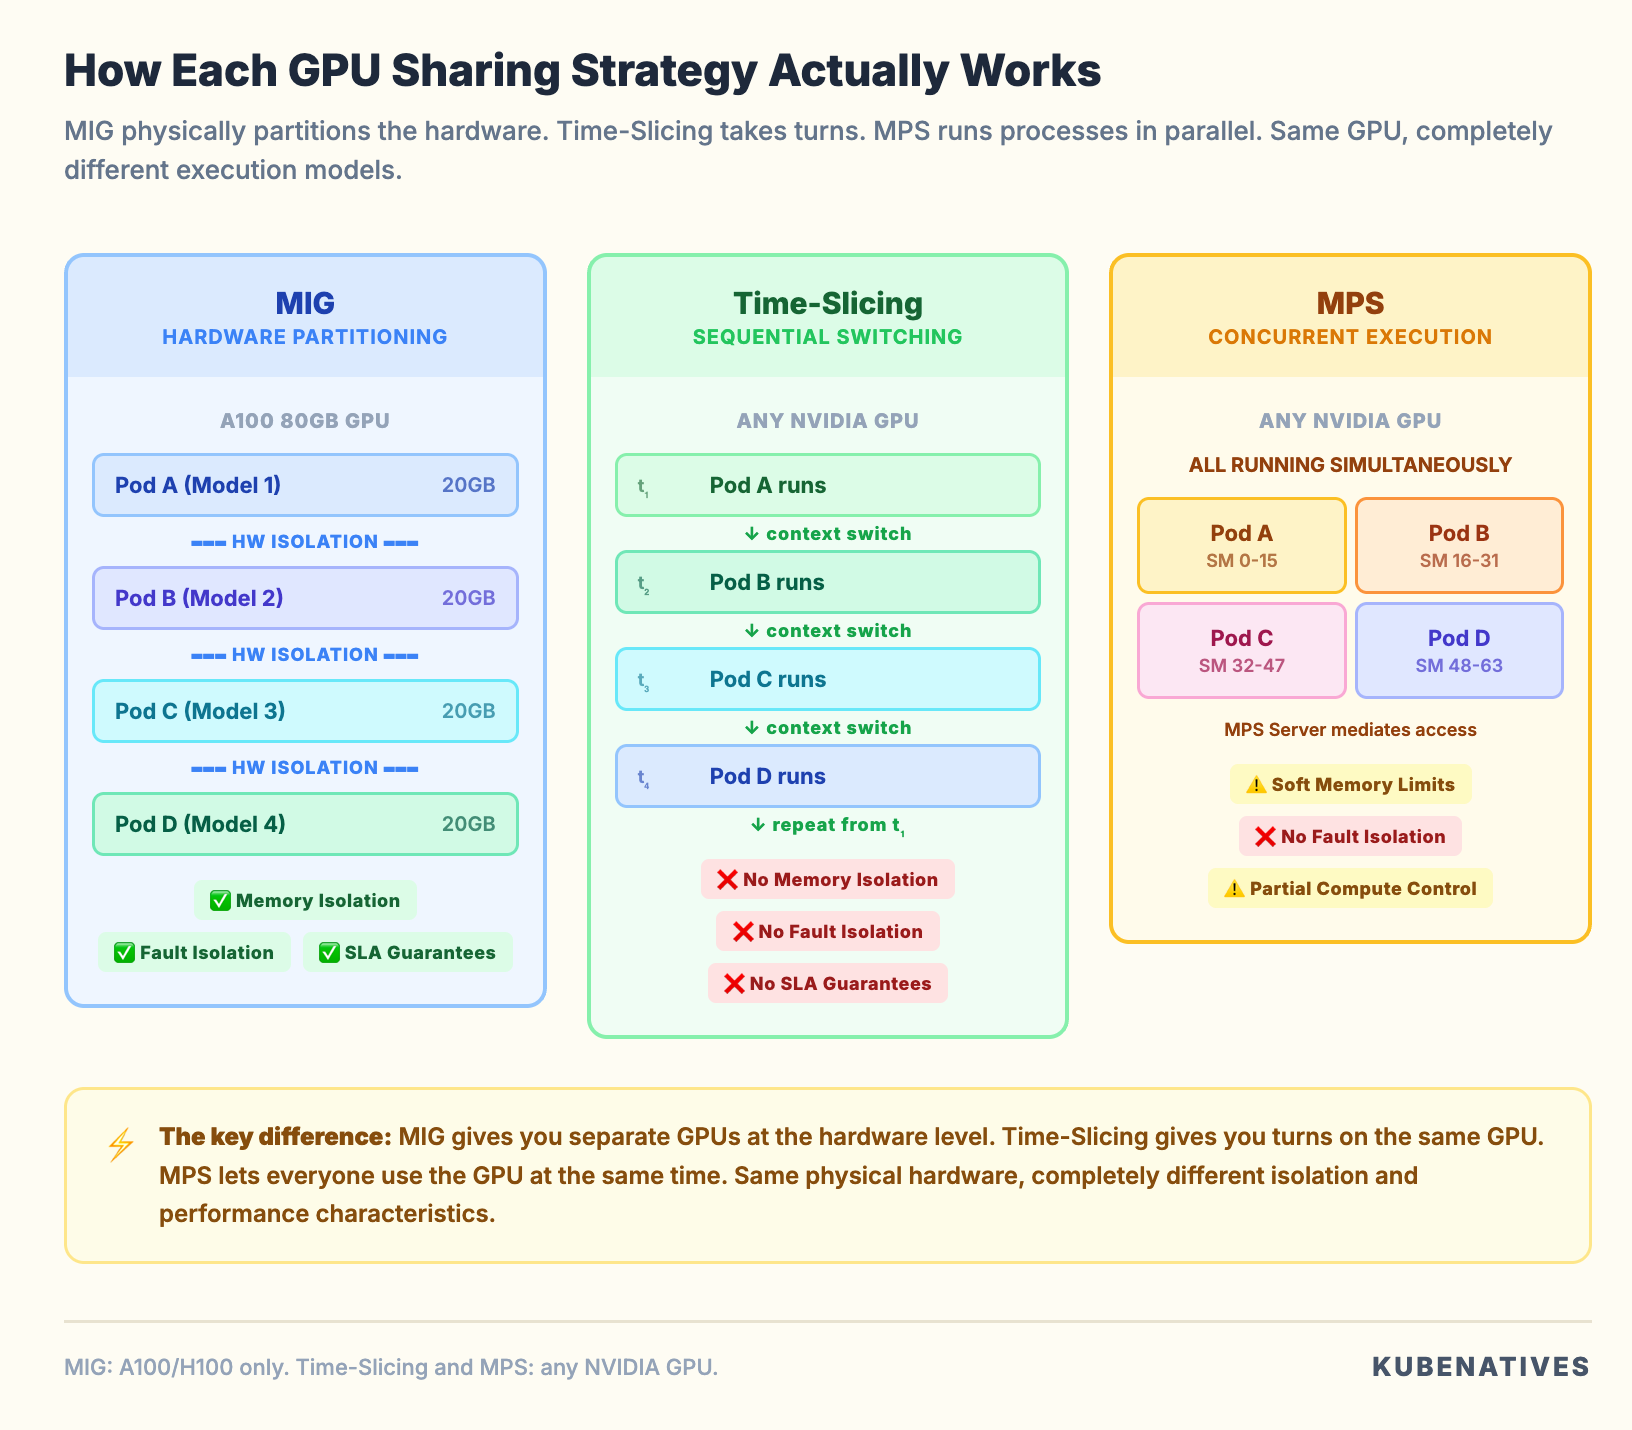
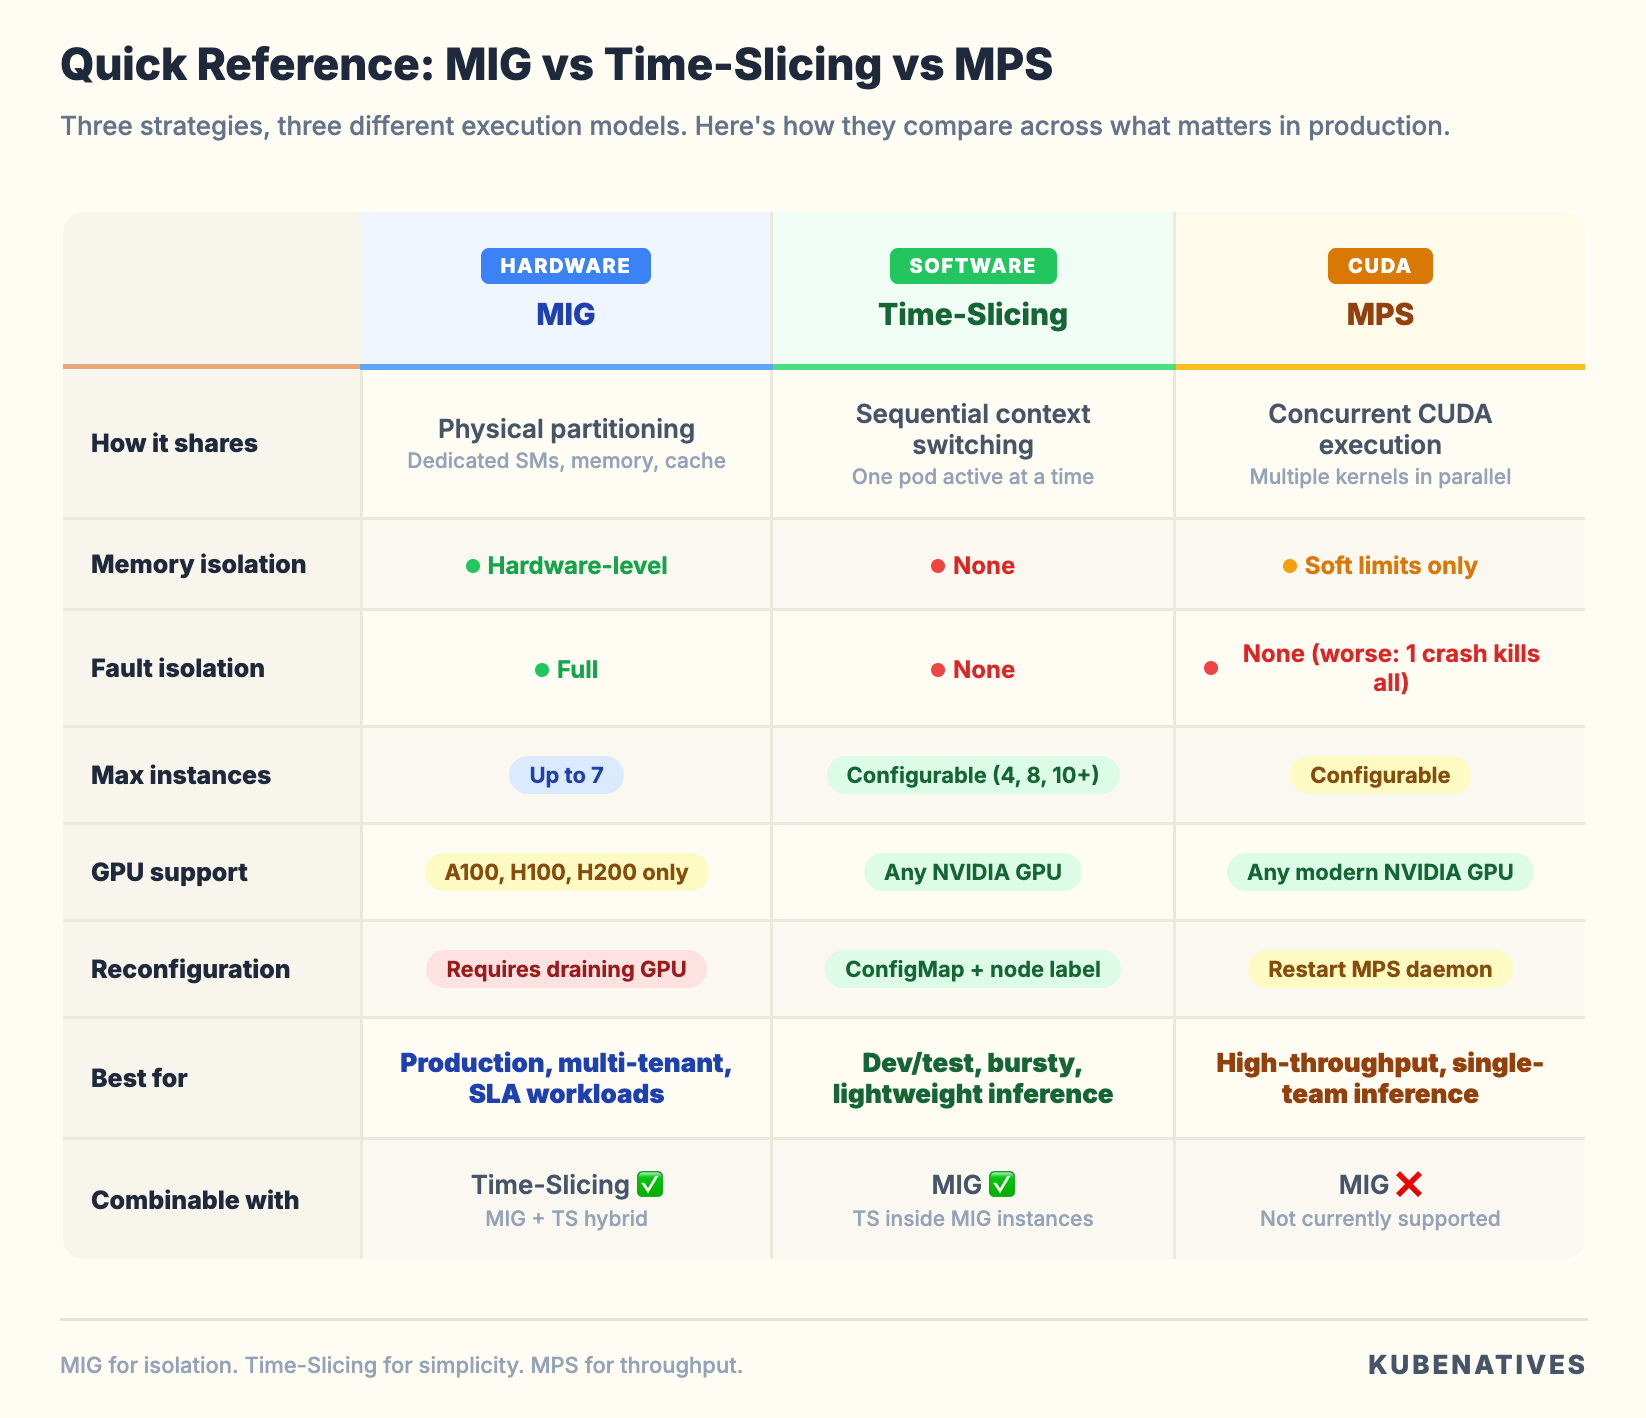
MIG: Hardware Level Partitioning
Multi-Instance GPU is built into the GPU silicon itself. It is available on NVIDIA Ampere (A100, A30) and Hopper (H100, H200) architectures.
MIG physically partitions a GPU into up to seven independent instances. Each instance gets its own dedicated Streaming Multiprocessors, memory controllers, L2 cache, and VRAM allocation.
How it works in Kubernetes
When MIG is enabled, the GPU Operator’s MIG Manager creates instances based on a profile you configure. Each instance appears as a separate resource to the device plugin.
Instead of advertising nvidia.com/gpu: 1, the node advertises resources like:
nvidia.com/mig-1g.5gb: 7    # Seven 1g.5gb instances
nvidia.com/mig-2g.10gb: 3   # Three 2g.10gb instances
nvidia.com/mig-3g.20gb: 2   # Two 3g.20gb instances
Pods request a specific MIG profile:
resources:
  limits:
    nvidia.com/mig-1g.5gb: 1
The scheduler treats each MIG instance as a separate resource. A pod on a 1g.5gb instance can only access the memory and compute allocated to that instance. It cannot see or affect other instances on the same physical GPU.
What MIG gives you
True hardware isolation. Each MIG instance has its own memory controller and L2 cache. A pod on instance A cannot access the memory of instance B. If a process on instance A crashes, instance B is completely unaffected. This is the same isolation you get from physically separate GPUs.
Predictable performance. Each instance has dedicated compute and memory bandwidth. The performance of one instance does not degrade when other instances are under load. You can make SLA guarantees per instance.
Error isolation. A GPU fault in one instance does not affect other instances. For production serving where uptime matters, this is significant.
What MIG costs you
Limited GPU support. MIG only works on A100, A30, H100, H200, and H800 GPUs. If you run T4s, V100s, or A10Gs, MIG is not an option.
Fixed partition sizes. You cannot create arbitrary MIG profiles. Each GPU model supports a specific set of predefined profiles. On an A100 40GB, you choose from 1g.5gb, 2g.10gb, 3g.20gb, 4g.20gb, and 7g.40gb. You pick from a menu. You do not define custom sizes.
Reconfiguration requires draining. Changing the MIG profile requires stopping all workloads on that GPU first. You cannot dynamically repartition under load. Plan your profiles ahead of time and match them to your workload sizes.
Maximum 7 instances. Even on the largest GPUs, you can only create up to 7 MIG instances. If you need to share a GPU among 10 or 20 lightweight workloads, MIG alone is not enough.
When to use MIG
Production inference serving where you need SLA guarantees per model. Multi-tenant environments where different teams share GPU node pools. Any scenario where memory isolation is a hard requirement.
Time-Slicing: Software Level Multiplexing
Time-Slicing is the simplest GPU sharing strategy. It makes a single GPU appear as multiple “replicas” to the device plugin. The GPU’s compute time is shared among all pods through CUDA’s context switching mechanism.
How it works in Kubernetes
You configure a ConfigMap that tells the device plugin how many replicas to create per GPU:
apiVersion: v1
kind: ConfigMap
metadata:
  name: time-slicing-config
  namespace: gpu-operator
data:
  any: |-
    version: v1
    sharing:
      timeSlicing:
        resources:
          - name: nvidia.com/gpu
            replicas: 4
After applying this and labeling your nodes, a node with 1 physical GPU advertises nvidia.com/gpu: 4. The scheduler sees 4 available GPUs. It can place up to 4 pods. Each pod thinks it has a dedicated GPU. In reality they all share the same physical hardware.
The GPU switches between the pods’ CUDA contexts, giving each one a “time slice” of the compute resources. This is similar to how a CPU time slices between processes.
What Time-Slicing gives you
Works on any NVIDIA GPU. T4, V100, A10G, A100, H100. Any GPU the device plugin supports. No hardware generation requirements.
Zero workload changes. Your pods do not need to know they are sharing. They request nvidia.com/gpu: 1 exactly like they would for an exclusive GPU. The sharing is transparent.
Configurable oversubscription. You decide how many replicas per GPU. 4 replicas, 8 replicas, 10 replicas. Whatever makes sense for your workload density.
What Time-Slicing costs you
No memory isolation. This is the big one. All pods sharing a GPU have access to the full GPU memory. There are no limits on how much VRAM each pod can allocate.
If one pod allocates 70GB of VRAM on an 80GB GPU, the other three pods will OOM when they try to allocate even a small amount.
You can set 4 replicas. But there is no mechanism to say “each replica gets 20GB.” The pods are on the honor system. Pods do not have honor.
No fault isolation. A CUDA error in one pod can affect all other pods sharing the same GPU. One misbehaving workload can take down three others.
No performance guarantees. When multiple pods actively use the GPU, they share compute time equally. Four active pods each get roughly 25% of the compute throughput. A pod’s performance degrades proportionally to the number of active neighbors.
Context switching overhead. The GPU saves and restores state when switching between CUDA contexts. For workloads with large GPU memory footprints, this overhead can be significant.
When to use Time-Slicing
Development and testing environments where isolation does not matter. Lightweight inference workloads where each model uses a small fraction of GPU memory. Older GPU hardware (T4, V100) where MIG is not available. Teams that want the simplest possible path to GPU sharing.
MPS: CUDA Level Concurrent Execution
Multi-Process Service is a CUDA feature that allows multiple processes to execute on the GPU simultaneously. Not by taking turns like Time-Slicing. By actually running CUDA kernels from different processes in parallel on different Streaming Multiprocessors.
How it works in Kubernetes
MPS requires running an MPS daemon on each GPU node. The NVIDIA device plugin supports MPS as a sharing mode:
apiVersion: v1
kind: ConfigMap
metadata:
  name: mps-config
  namespace: gpu-operator
data:
  any: |-
    version: v1
    sharing:
      mps:
        resources:
          - name: nvidia.com/gpu
            replicas: 4
Like Time-Slicing, this makes one GPU appear as 4 resources. But the execution model is fundamentally different.
With Time-Slicing, only one CUDA context is active at a time. The GPU switches between them.
With MPS, multiple CUDA contexts run concurrently. The MPS server mediates access to the GPU’s Streaming Multiprocessors. Kernels from different processes execute in parallel.
What MPS gives you
True concurrent execution. Multiple pods run CUDA kernels on the GPU at the same time. For workloads that do not fully utilize the GPU’s compute capacity, this means significantly higher aggregate throughput compared to Time-Slicing.
Reduced context switching overhead. Processes run concurrently rather than sequentially. No context switch penalty. The GPU does not need to save and restore state between processes.
Compute partitioning (partial). You can limit the percentage of Streaming Multiprocessors available to each MPS client using CUDA_MPS_ACTIVE_THREAD_PERCENTAGE. This gives you some control over compute allocation.
Memory limits. MPS supports per-client memory limits through CUDA_MPS_PINNED_DEVICE_MEM_LIMIT. You can cap how much GPU memory each client can allocate. This provides some memory protection that Time-Slicing lacks entirely.
What MPS costs you
No memory isolation. Despite supporting memory limits, MPS does not provide hardware-level memory isolation. Processes share the same memory space. A rogue process can potentially read or corrupt another process’s GPU memory. The memory limits are enforced at the CUDA API level, not the hardware level.
Single user assumption. MPS was designed for single-user environments where all processes are trusted. In multi-tenant Kubernetes environments, this assumption may not hold.
Incompatible with MIG. You cannot use MPS inside MIG instances as of current GPU Operator versions. It is one or the other.
Error propagation. A fatal CUDA error from one MPS client terminates the MPS server. This kills all other clients sharing that GPU. One bad deployment takes down every model on that GPU. This is worse than Time-Slicing. Time-Slicing causes intermittent interference. MPS causes immediate total failure.
When to use MPS
High throughput inference with multiple small models where concurrent execution improves aggregate throughput. Workloads from a single team where all processes are trusted. Scenarios where Time-Slicing’s sequential execution is a throughput bottleneck.
The Decision Framework
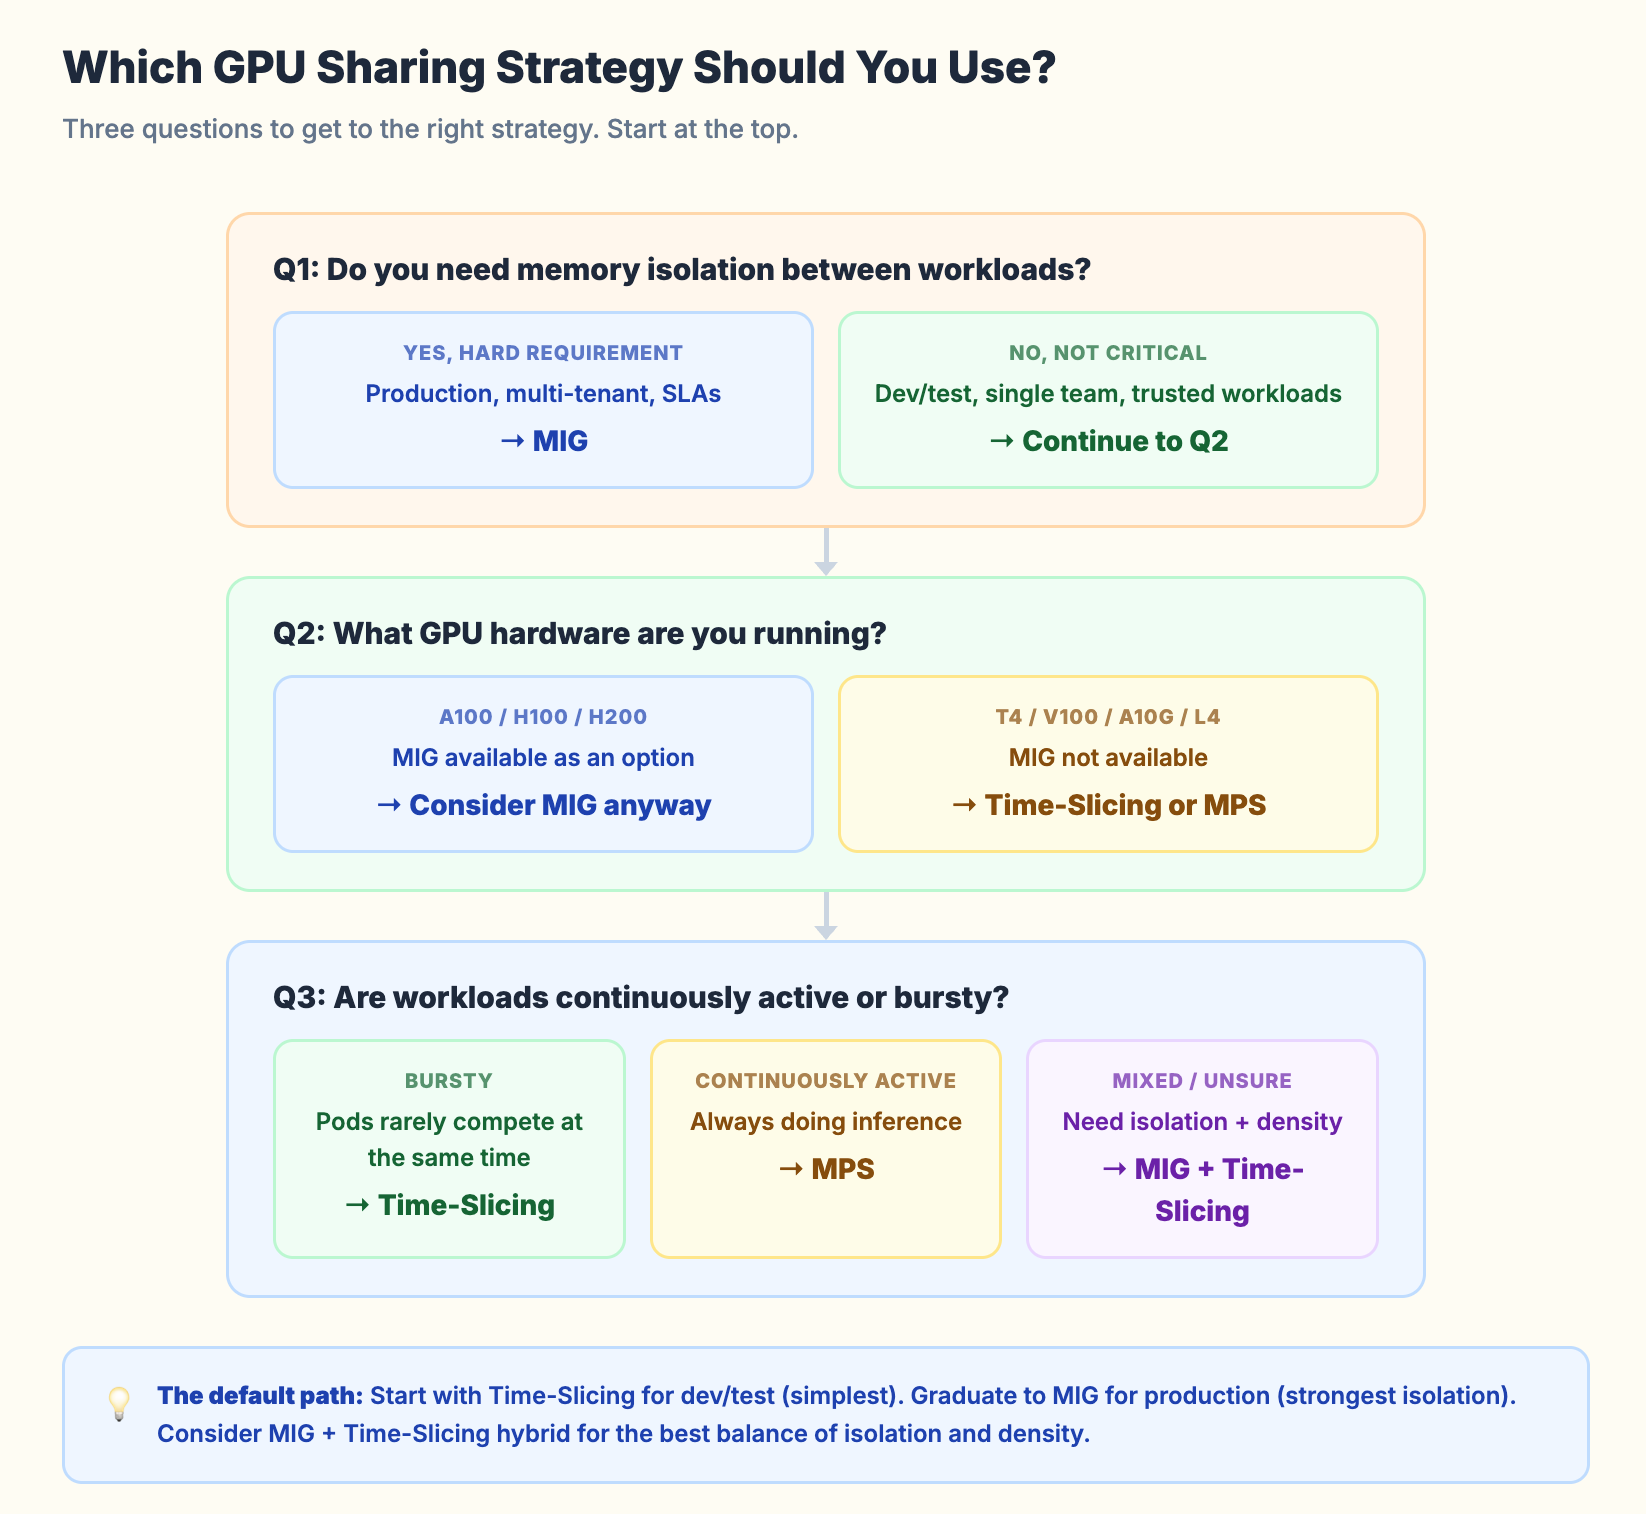
Start with the isolation requirement.
If you need memory isolation and SLA guarantees per workload, the answer is MIG. No other option provides hardware-level isolation. If your workloads run on A100 or H100 GPUs and isolation matters, MIG is the only correct choice.
If you do not need isolation (dev/test, single-team workloads, lightweight inference), you can choose between Time-Slicing and MPS.
Then consider your GPU hardware.
MIG requires Ampere or Hopper GPUs. If you run older hardware (T4, V100) or mid-range GPUs (A10G, L4), MIG is not available. Your options are Time-Slicing or MPS.
Then consider your workload pattern.
Bursty workloads (high utilization for short periods, then idle) work well with Time-Slicing. The sequential execution does not matter because the pods rarely compete for compute at the same time.
Continuously active workloads (always doing inference, always using GPU compute) benefit from MPS. Kernels run in parallel rather than sequentially, which gives better aggregate throughput.
The hybrid approach.
For production H100/A100 clusters, you can combine MIG with Time-Slicing. Create MIG instances for hardware isolation. Then apply Time-Slicing within each MIG instance for additional density.
Example: partition an A100 into two 3g.20gb MIG instances. Apply 2x Time-Slicing on each instance. You now have 4 “GPU slots.” Each one has 20GB of isolated memory. Pairs share via Time-Slicing. This is the best of both worlds for many inference workloads.
Kubernetes Resource Comparison
Here is what each strategy looks like from the scheduler’s perspective:
Default (no sharing):
# Node advertises:
nvidia.com/gpu: 1

# Pod requests:
nvidia.com/gpu: 1
# Gets entire physical GPU
MIG:
# Node advertises:
nvidia.com/mig-1g.5gb: 7

# Pod requests:
nvidia.com/mig-1g.5gb: 1
# Gets isolated MIG instance with 5GB VRAM
Time-Slicing (4 replicas):
# Node advertises:
nvidia.com/gpu: 4   # Oversubscribed from 1 physical GPU

# Pod requests:
nvidia.com/gpu: 1
# Gets shared access, no memory limit
MPS (4 replicas):
# Node advertises:
nvidia.com/gpu: 4   # Oversubscribed from 1 physical GPU

# Pod requests:
nvidia.com/gpu: 1
# Gets concurrent access via MPS server
Time-Slicing and MPS look identical from the scheduler’s perspective. The difference is entirely in the runtime behavior. The scheduler does not know whether it is assigning an exclusive GPU, a MIG instance, a time slice, or an MPS client.
This is both elegant (transparent to workloads) and dangerous (no visibility into actual resource guarantees).
Common Mistakes
Mistake 1: Using Time-Slicing for production inference without memory limits. You set 4 replicas on an 80GB A100. Three pods use 15GB each. The fourth pod deploys a larger model that allocates 40GB. One of the first three pods OOMs on its next request. There is no mechanism to prevent this.
Mistake 2: Choosing MIG profiles that do not match workload sizes. You create seven 1g.5gb instances on an A100. Your smallest model needs 8GB. None of the instances are usable. Plan your MIG profiles around your actual model memory requirements.
Mistake 3: Forgetting that MIG reconfiguration requires draining. You cannot change MIG profiles while workloads are running. Cordon the node. Drain the GPU workloads. Reconfigure. Uncordon. Automate this or you will be doing it manually at 2 AM.
Mistake 4: Ignoring the MPS error propagation risk. One MPS client crash kills the MPS server and all other clients. In production, one bad deployment can take down every model on that GPU. If you use MPS, make sure your workloads are well tested.
Mistake 5: Not monitoring actual GPU utilization after enabling sharing. You enabled 8x Time-Slicing. The node shows 8 “GPUs” allocated. But what is the actual SM utilization? What is the actual memory usage? Without DCGM Exporter metrics, you are flying blind. GPU sharing without GPU monitoring is just organized waste.
The Monitoring You Need
Whatever sharing strategy you choose, you need visibility into what is actually happening on the GPU:
DCGM_FI_DEV_GPU_UTIL          # SM (compute) utilization %
DCGM_FI_DEV_FB_USED           # Framebuffer (VRAM) used in MB
DCGM_FI_DEV_FB_FREE           # Framebuffer free in MB
DCGM_FI_DEV_MEM_COPY_UTIL     # Memory bandwidth utilization %
DCGM_FI_PROF_SM_ACTIVE        # SM active (more granular)
With DCGM Exporter (part of the GPU Operator), these metrics are available in Prometheus. Build a dashboard that shows per-GPU utilization alongside your sharing configuration.
If you set 4x Time-Slicing and actual SM utilization is 95%, you are oversubscribed. If it is 20%, you could go to 8x.
The goal of GPU sharing is not maximum pod count per GPU. It is maximum useful work per GPU dollar.
The Bottom Line
MIG when you need isolation. Time-Slicing when you need simplicity. MPS when you need throughput.
Start with Time-Slicing for dev/test. Graduate to MIG for production. Consider MPS for high-throughput single-team inference workloads. Use the MIG plus Time-Slicing hybrid for the best balance of isolation and density.
Do not pick a sharing strategy without monitoring GPU utilization first. Measure your actual workload memory and compute usage. Then choose the strategy that matches your isolation requirements and hardware capabilities.
Next week: Deploying vLLM on Kubernetes: From Single Pod to Production.
If you manage GPU clusters on Kubernetes, I cover GPU infrastructure, model serving, and production operations every week. Subscribe at kubenatives.com.