
NVIDIA GPU Operator on Kubernetes: What It Actually Does Under the Hood
It’s not one componeIt is not one component. It is eight. Most engineers only know about one of them.nt. It’s seven — and most engineers only know about one of them.

When a GPU pod gets stuck in Pending, most engineers start debugging the scheduler.
Wrong place to look.
90% of the time, the problem is the NVIDIA GPU Operator. Specifically, one of its eight components didn’t initialize properly.
But to know which one, you need to understand what the GPU Operator actually does. How the components depend on each other. And what happens when one of them breaks.
This article goes through every component in the order they initialize. And what breaks when they don’t.
What the GPU Operator Actually Is
The GPU Operator is a Kubernetes operator that automates everything NVIDIA related on your GPU nodes.
Without it, you would need to manually install GPU drivers, configure the container runtime, set up the device plugin, configure monitoring, and handle MIG partitioning. On every single node. Every time you scale.
The operator wraps all of that into a single Helm install:
helm install gpu-operator nvidia/gpu-operator \
  -n gpu-operator --create-namespace
This deploys eight components as DaemonSets across your GPU nodes. Each one does a specific job. They initialize in a specific order because each depends on the one before it.
This is the part most people miss. The GPU Operator is not one thing. It is a carefully orchestrated chain. The chain breaks at the weakest link.
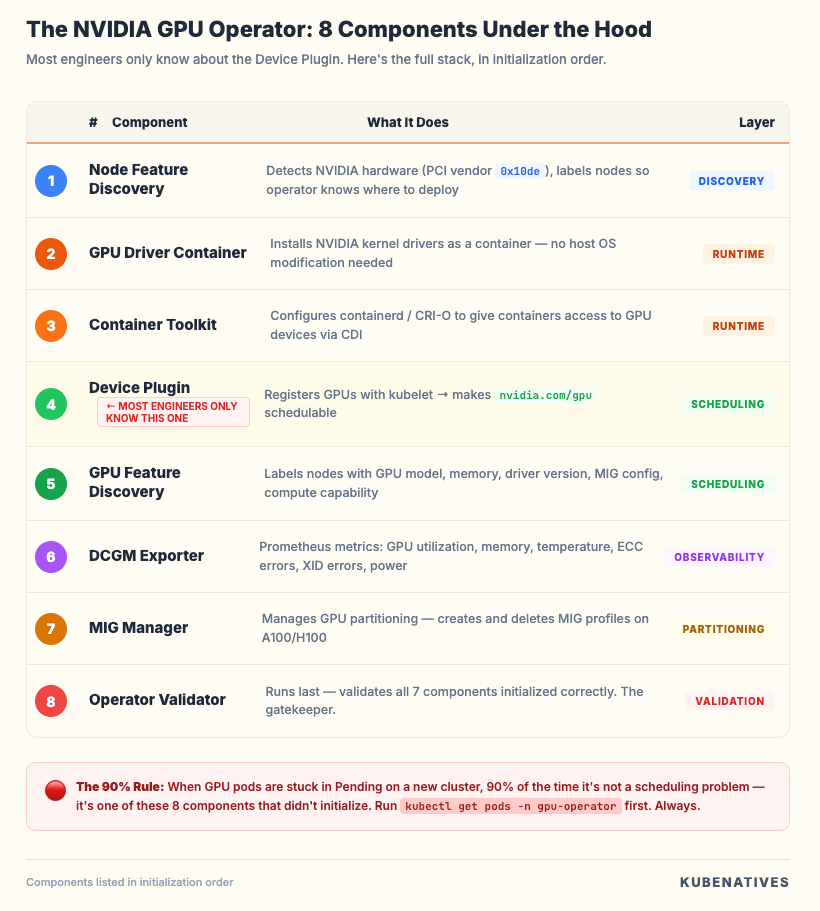
Component 1: Node Feature Discovery (NFD)
What it does. Before the GPU Operator can do anything, Kubernetes needs to know which nodes have GPUs.
NFD runs on every node and detects hardware features. PCI devices, CPU capabilities, USB devices. It applies labels to nodes based on what it finds.
For GPU nodes, the critical label is:
feature.node.kubernetes.io/pci-10de.present=true
0x10de is NVIDIA’s PCI vendor ID. This label tells the GPU Operator “this node has NVIDIA hardware, deploy the stack here.”
What breaks. If NFD is not running, no labels get applied. No labels means the GPU Operator’s DaemonSets have no nodes to target. Every other component silently does nothing. No errors. No failures. Just nothing deployed.
Debug:
# Check if NFD is running
kubectl get pods -n gpu-operator -l app.kubernetes.io/component=worker

# Check if GPU labels exist on your nodes
kubectl get nodes -l feature.node.kubernetes.io/pci-10de.present=true
If that second command returns nothing, NFD is your problem.
Component 2: GPU Driver Container
What it does. Installs the NVIDIA GPU driver directly into a container without modifying the host OS.
This is the foundational layer. Nothing else works without the driver. The driver container mounts the host’s kernel modules and installs the NVIDIA kernel driver. This makes the GPU accessible at the hardware level.
Traditional GPU setup requires installing drivers directly on the host. That ties you to specific OS versions and makes driver upgrades painful. The containerized driver decouples the driver lifecycle from the OS lifecycle.
What breaks. Driver initialization failures are the most common GPU Operator issue. Three common causes:
The nouveau Linux kernel module is loaded and conflicts with the NVIDIA driver. The driver container cannot always unload it automatically.
Kernel version mismatches. The driver container needs to compile kernel modules that match your host kernel.
On managed Kubernetes (AKS, GKE, EKS), the platform may pre-install drivers. You need to set driver.enabled=false to avoid conflicts.
Debug:
# Check driver pod status
kubectl get pods -n gpu-operator -l app=nvidia-driver-daemonset

# Check driver logs
kubectl logs -n gpu-operator -l app=nvidia-driver-daemonset -c nvidia-driver-ctr

# Verify driver is loaded on node
kubectl exec -n gpu-operator <driver-pod> -c nvidia-driver-ctr -- nvidia-smi
If nvidia-smi does not return GPU info, nothing downstream will work.
Component 3: NVIDIA Container Toolkit
What it does. Configures the container runtime (containerd or CRI-O) to be GPU aware.
Without this, even if the driver is installed, containers have no way to access the GPU hardware. The toolkit creates an nvidia runtime class and registers it with your container runtime.
When a pod requests GPU resources, Kubernetes uses this runtime class to set up the GPU device mappings inside the container.
In recent versions, the toolkit uses the Container Device Interface (CDI) specification. This simplifies how GPU devices are exposed to containers compared to the legacy approach.
What breaks. If the container toolkit pod is in Init state, it is usually waiting for the driver container to be ready. It depends on it. If it is crashing, check the container runtime configuration.
Debug:
# Check toolkit pod status
kubectl get pods -n gpu-operator -l app=nvidia-container-toolkit-daemonset

# Verify the nvidia runtime is configured (containerd)
kubectl exec -n gpu-operator <toolkit-pod> -- \
  cat /etc/containerd/config.toml | grep nvidia
Component 4: NVIDIA Device Plugin
What it does. This is the component most engineers know about. And the only one most think about.
The device plugin registers GPUs as schedulable resources in Kubernetes using the device plugin framework. After this runs, nodes advertise nvidia.com/gpu as an allocatable resource.
This is what allows you to write:
resources:
  limits:
    nvidia.com/gpu: 1
The device plugin talks to the kubelet via gRPC and reports: “This node has N GPUs available.” The scheduler uses this information to place GPU pods.
What breaks. The device plugin depends on the container toolkit. If the toolkit did not configure the runtime correctly, the device plugin cannot expose GPUs.
This is the dependency chain in action. The problem looks like a device plugin issue. But the root cause is two components back.
Important: The device plugin treats GPUs as integers. When you request nvidia.com/gpu: 1, you get an entire physical GPU. There is no fractional GPU support at this level. For GPU sharing (MIG, time-slicing, MPS), you need additional configuration.
Debug:
# Check what's allocatable on GPU nodes
kubectl describe node <gpu-node> | grep -A5 "Allocatable"

# Check device plugin logs
kubectl logs -n gpu-operator -l app=nvidia-device-plugin-daemonset
Component 5: GPU Feature Discovery (GFD)
What it does. Detects the specific characteristics of GPUs on each node and applies detailed labels.
While NFD tells Kubernetes “this node has an NVIDIA device,” GFD tells it exactly what kind:
nvidia.com/gpu.product=NVIDIA-H100-80GB-HBM3
nvidia.com/gpu.memory=81920
nvidia.com/gpu.count=8
nvidia.com/cuda.driver-version.full=550.54.15
nvidia.com/mig.capable=true
These labels are critical for scheduling in mixed clusters. If you have A100s and T4s, GFD labels let you use node affinity to place workloads on the right GPU type:
affinity:
  nodeAffinity:
    requiredDuringSchedulingIgnoredDuringExecution:
      nodeSelectorTerms:
      - matchExpressions:
        - key: nvidia.com/gpu.product
          operator: In
          values:
          - NVIDIA-H100-80GB-HBM3
What breaks. If GFD fails, your GPUs still work. Pods can still be scheduled. But you lose the ability to target specific GPU types. In a mixed cluster, a workload that needs an H100’s 80GB memory might land on a T4 with 16GB and OOM immediately.
Debug:
kubectl get node <gpu-node> -o json | jq '.metadata.labels | with_entries(select(.key | startswith("nvidia.com")))'
Component 6: DCGM Exporter
What it does. Deploys the NVIDIA Data Center GPU Manager and a Prometheus exporter that exposes GPU metrics. This is your observability layer.
Key metrics:
DCGM_FI_DEV_GPU_UTIL          # GPU compute utilization
DCGM_FI_DEV_FB_USED           # Framebuffer (GPU memory) usage
DCGM_FI_DEV_GPU_TEMP          # GPU temperature
DCGM_FI_DEV_POWER_USAGE       # Power consumption
DCGM_FI_DEV_ECC_SBE_VOL_TOTAL # Single-bit ECC errors (early warning)
DCGM_FI_DEV_XID_ERRORS        # XID errors (GPU reporting problems)
Why this matters. Without DCGM, you are flying blind on GPU health. You will not know that a GPU is thermal throttling. Or that memory is filling up. Or that ECC errors are accumulating, which predicts hardware failure.
We monitor these in our H100 clusters and have caught degrading GPUs before they caused workload failures.
Debug:
kubectl get pods -n gpu-operator -l app=nvidia-dcgm-exporter

kubectl exec -n gpu-operator <dcgm-pod> -- curl -s localhost:9400/metrics | head -20
Component 7: MIG Manager
What it does. Manages Multi-Instance GPU (MIG) partitioning on A100 and H100 GPUs.
MIG lets you split a single physical GPU into up to seven isolated instances. Each gets dedicated compute, memory, and memory bandwidth.
The MIG Manager reads a ConfigMap that defines your desired MIG configuration and applies it:
apiVersion: v1
kind: ConfigMap
metadata:
  name: mig-parted-config
  namespace: gpu-operator
data:
  config.yaml: |
    version: v1
    mig-configs:
      all-3g.40gb:
        - devices: all
          mig-enabled: true
          mig-devices:
            3g.40gb: 2
Why this matters. Without MIG, requesting nvidia.com/gpu: 1 gives you an entire 80GB H100. Even if your workload only needs 10GB. That is $30K worth of GPU sitting at 12% utilization. MIG is how you stop the waste.
What breaks. MIG configuration changes require a GPU reset. Pods using the GPU must be evicted first. The MIG Manager handles this orchestration. But if pods have PodDisruptionBudgets that prevent eviction, MIG reconfiguration stalls silently.
Debug:
kubectl get pods -n gpu-operator -l app=nvidia-mig-manager

kubectl exec -n gpu-operator <driver-pod> -c nvidia-driver-ctr -- nvidia-smi mig -lgi
Component 8: Operator Validator
What it does. The final link in the chain.
The validator runs after all other components and performs health checks. It confirms the driver is loaded. The toolkit is configured. The device plugin is registering GPUs. MIG partitioning is applied correctly (if configured).
Until the validator passes, the GPU Operator reports the node as not ready for GPU workloads. This is the gatekeeper.
What breaks. The validator is the most common pod you will see stuck in Init:0/4 or CrashLoopBackOff.
But the validator itself is not the problem. It is reporting that something upstream failed.
The 0/4 tells you it has 4 init containers: driver validation, toolkit validation, device plugin validation, and optionally MIG validation. None have passed yet.
Do not debug the validator. Look upstream.
Debug:
kubectl get pods -n gpu-operator -l app=nvidia-operator-validator

kubectl describe pod -n gpu-operator <validator-pod>

kubectl logs -n gpu-operator <validator-pod> -c driver-validation
The Initialization Chain
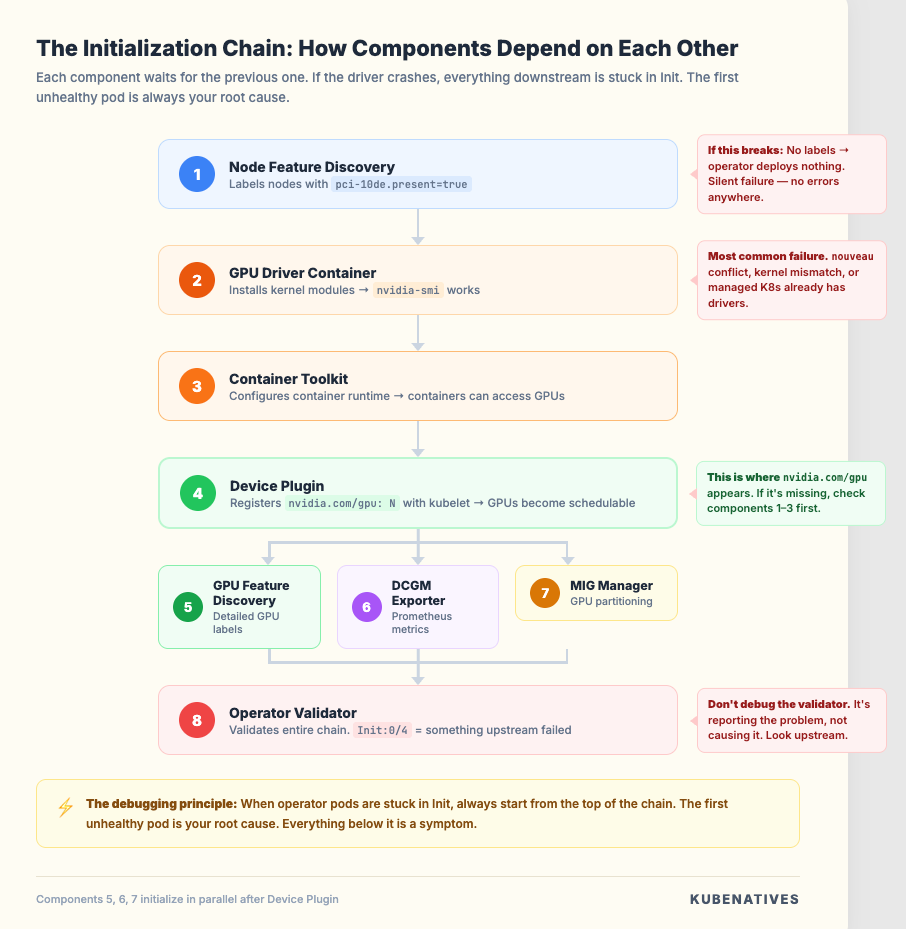
This is the critical mental model. The components do not initialize independently. They form a dependency chain:
NFD → Driver → Container Toolkit → Device Plugin → GFD
                                                     ↓
                            DCGM Exporter ← MIG Manager
                                                     ↓
                                               Validator
Each component has init containers that wait for the previous component to be healthy. If the driver pod is crashing, every downstream component will be stuck in Init state.
This is why a driver issue looks like “everything is broken.” The entire chain is waiting.
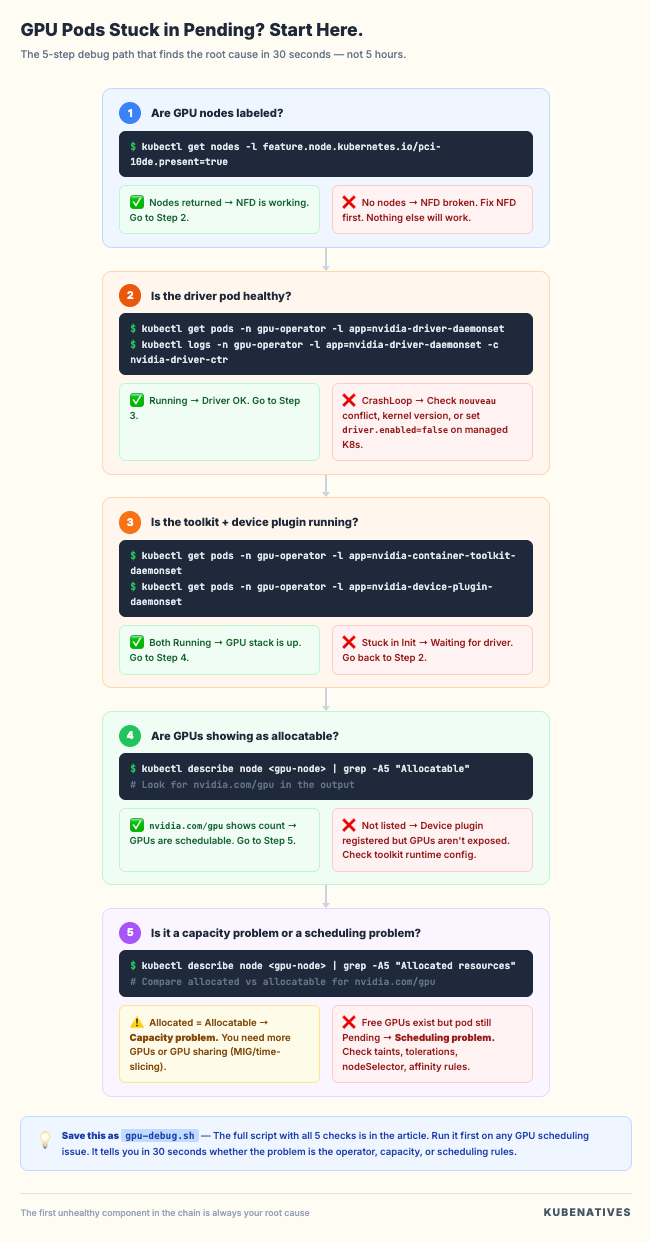
The debugging principle. When GPU pods are stuck in Pending or operator pods are stuck in Init, always start from the top of the chain:
# Step 1: Is NFD running and labeling nodes?
kubectl get nodes -l feature.node.kubernetes.io/pci-10de.present=true

# Step 2: Is the driver pod healthy?
kubectl get pods -n gpu-operator -l app=nvidia-driver-daemonset

# Step 3: Is the toolkit pod healthy?
kubectl get pods -n gpu-operator -l app=nvidia-container-toolkit-daemonset

# Step 4: Is the device plugin healthy?
kubectl get pods -n gpu-operator -l app=nvidia-device-plugin-daemonset

# Step 5: Are GPUs showing as allocatable?
kubectl describe node <gpu-node> | grep -A5 "Allocated resources"
The first unhealthy pod in this chain is your root cause. Everything below it is a symptom.
Common Production Patterns
After running H100 clusters in production, these patterns come up repeatedly:
Pattern 1: Nodes join but GPUs are not schedulable. Usually NFD or the driver. Check NFD labels first, then driver pod status. On managed K8s (AKS, GKE, EKS), remember to set driver.enabled=false if the platform pre-installs drivers.
Pattern 2: GPU pods schedule fine, then suddenly stop. The MIG Manager reconfigured GPUs and the device plugin re-registered with a different resource count. Check if someone changed the MIG ConfigMap.
Pattern 3: nvidia-smi shows the GPU but pods cannot use it. Container toolkit issue. The runtime is not configured with the nvidia handler. Check the container runtime config files.
Pattern 4: Intermittent GPU failures in running pods. Check DCGM metrics for XID errors and ECC error accumulation. Hardware degradation shows up in metrics before it causes workload failures. XID 48 (double-bit ECC error) means the GPU needs replacement.
Pattern 5: Everything was working, then a node reboot broke it. The driver container needs to reinitialize after reboot. If it is stuck in CrashLoopBackOff, check for nouveau module conflicts. Some Linux distributions reload it on boot.
The Bottom Line
The GPU Operator is eight components pretending to be one. Understanding the initialization chain and dependency order is the difference between 5 minute debugging and 5 hour debugging.
When GPU pods are pending:
Do not blame the scheduler. Run kubectl get pods -n gpu-operator. Find the first unhealthy pod in the chain. Fix that, and everything downstream recovers.
The GPU Operator handles the hard parts of running GPUs on Kubernetes. But when it breaks, you need to know which part broke. Now you do.
Next week: How vLLM serves models on Kubernetes.
If you are building GPU infrastructure on Kubernetes, I cover this intersection every week. Subscribe at kubenatives.com.