
Production Kubernetes Debugging: A Systematic Framework
Stop guessing. Start at the right layer and work your way down.

Something is wrong with your cluster.
Pods are stuck. Deployments are failing. API requests are slow. Users are complaining.
You open a terminal and start running commands. kubectl get pods. kubectl describe pod. kubectl logs. You scroll through the output looking for something that stands out.
Twenty minutes later, you’re deep in a rabbit hole, debugging a network policy that has nothing to do with the actual problem.
This is how most engineers debug Kubernetes. Randomly. They start with whatever command comes to mind first and hope to stumble on the root cause.
There is a better way. A systematic framework that works for every Kubernetes problem. It starts at the top of the stack and works down through five layers. Each layer has specific symptoms, specific commands, and a clear signal indicating whether to stay at that layer or move to the next.
The Five Layer Model
Every Kubernetes problem lives at one of five layers. The layers are ordered from most common to least common. Start at Layer 1 and work down. Most problems resolve in the first two layers.
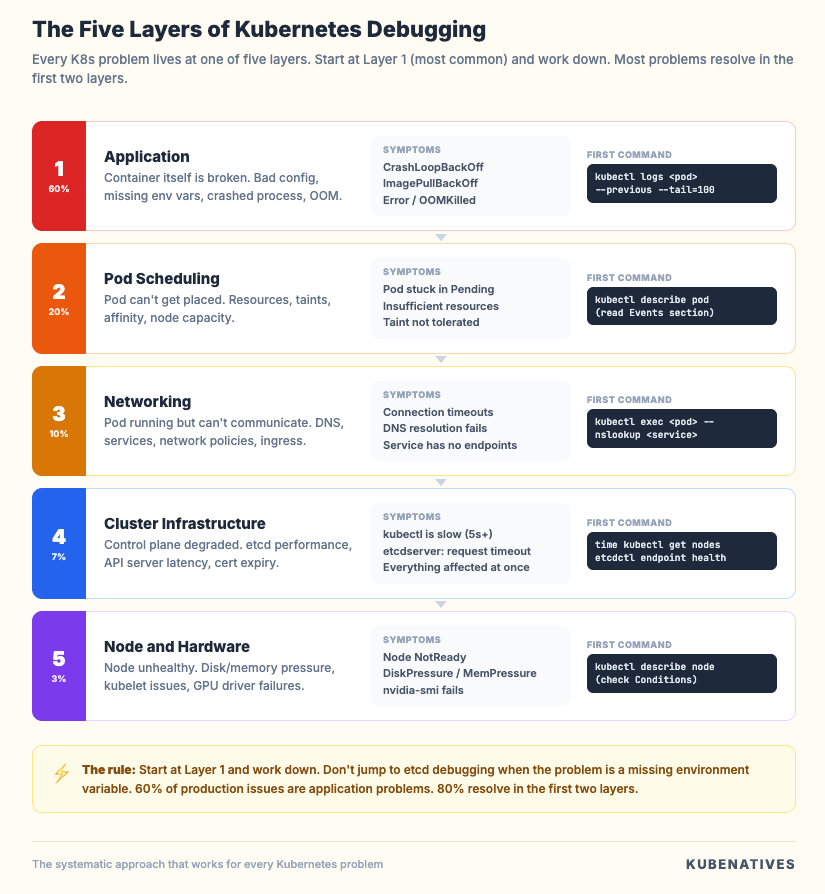
Layer 1: Application. The container itself is broken. Bad config, missing env vars, crashed process, OOM.
Layer 2: Pod Scheduling. The pod can’t get placed on a node. Resource limits, taints, affinity rules, node capacity.
Layer 3: Networking. The pod is running, but can’t communicate. DNS failures, service misconfig, network policies, and ingress issues.
Layer 4: Cluster Infrastructure. The control plane is degraded. etcd performance, API server latency, scheduler delays, and certificate expiry.
Layer 5: Node and Hardware. The underlying node is unhealthy. Disk pressure, memory pressure, kubelet issues, and GPU driver failures.
The framework works because Kubernetes problems almost always manifest at the application layer first. A pod crashes. A deployment doesn’t roll out. A request times out. The root cause might be at any layer, but the symptoms always show up at the top.
Layer 1: Application Debugging
This is where 60% of production issues live. The container is doing something wrong. Before blaming Kubernetes, check the application.
The first three commands
Run these in order for any pod that isn’t healthy:
# 1. What is the pod doing right now?
kubectl get pod <pod-name> -o wide

# 2. What happened to it?
kubectl describe pod <pod-name>

# 3. What is the application saying?
kubectl logs <pod-name> --tail=100
The get pod output tells you the current state. Is it Running, Pending, CrashLoopBackOff, Error, or ImagePullBackOff? Each state points to a different problem.
The describe pod output tells you the history. Look at the Events section at the bottom. Read it from bottom to top. The first event is usually the trigger.
The logs output tells you what the application thinks is happening. If the container crashed, use --previous to see the last run’s logs before the crash.
kubectl logs <pod-name> --previous --tail=100
CrashLoopBackOff
This is the most common pod failure. The container starts, crashes, restarts, crashes again. Kubernetes backs off the restart interval exponentially.
The root cause is almost always in the application logs. Check:
# See the exit code
kubectl get pod <pod-name> -o jsonpath='{.status.containerStatuses[0].lastState.terminated.exitCode}'
Exit code 1 means the application crashed on its own. Check logs for the error.
Exit code 137 means Kubernetes killed the container. It ran out of memory (OOMKilled). Check:
kubectl describe pod <pod-name> | grep -i oom
If it was OOMKilled, the fix is either increasing the memory limit or fixing the memory leak in the application.
Exit code 143 means the container received SIGTERM. Kubernetes asked it to stop gracefully. This happens during rollouts, scaling, or node drains.
ImagePullBackOff
The container image can’t be downloaded. Check:
kubectl describe pod <pod-name> | grep -A5 "Events"
Common causes: wrong image name, wrong tag, private registry without image pull secrets, or the registry is down.
# Check if image pull secrets are configured
kubectl get pod <pod-name> -o jsonpath='{.spec.imagePullSecrets}'
Readiness and Liveness Probes
A pod is Running but not receiving traffic. The readiness probe is failing.
# Check probe configuration and recent failures
kubectl describe pod <pod-name> | grep -A10 "Readiness\|Liveness"
Common mistake: the readiness probe checks an endpoint that takes 30 seconds to respond, but the timeout is set to 1 second. The pod is healthy but Kubernetes thinks it isn’t.
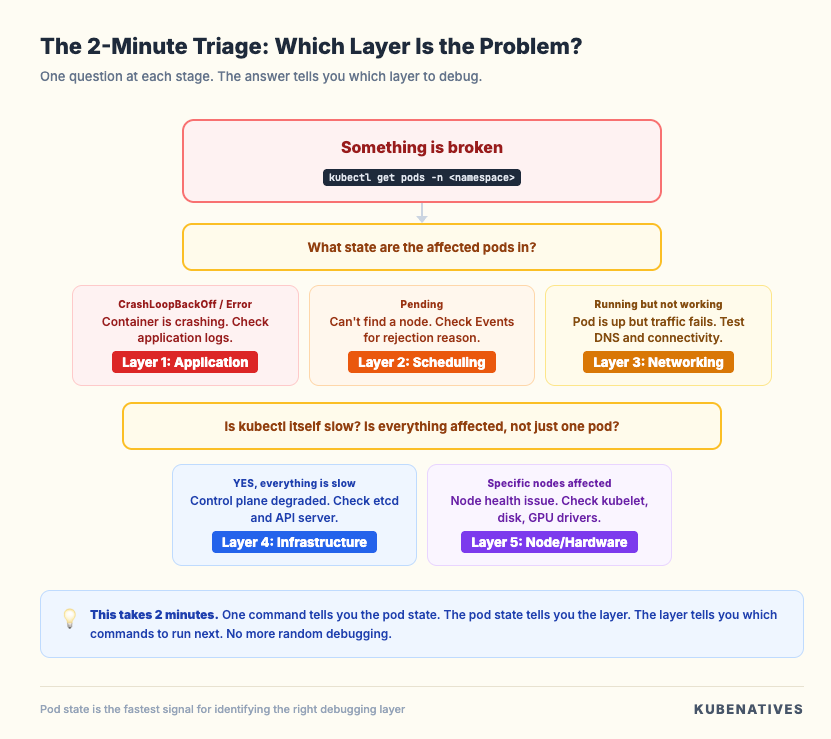
The signal to move to Layer 2
If kubectl describe pod shows the pod is Pending (not Running, not CrashLoopBackOff), the problem isn’t the application. The pod hasn’t been scheduled yet. Move to Layer 2.
Layer 2: Pod Scheduling
The pod exists but it’s stuck in Pending. Kubernetes can’t find a node to run it on.
The diagnostic command
kubectl describe pod <pod-name> | grep -A20 "Events"
The Events section tells you exactly why the scheduler rejected the pod. The message will say something like:
0/12 nodes are available: 6 Insufficient cpu, 4 node(s) had taint, 2 node(s) didn't match pod affinity.
Read this carefully. It tells you how many nodes exist, how many were filtered, and why each one was rejected.
Insufficient resources
# Check available resources across all nodes
kubectl top nodes

# Check a specific node's allocation
kubectl describe node <node-name> | grep -A15 "Allocated resources"
Compare the pod’s resource requests against what’s available. If the pod requests 4 CPU and 16Gi memory, but no node has that much free, the pod stays Pending.
The fix is either reducing the pod’s resource requests, adding more nodes, or cleaning up unused workloads to free resources.
Taints and tolerations
Nodes can have taints that repel pods. The pod needs a matching toleration to land on a tainted node. GPU nodes almost always have taints.
# Check node taints
kubectl describe node <node-name> | grep -A3 "Taints"

# Check pod tolerations
kubectl get pod <pod-name> -o jsonpath='{.spec.tolerations}' | jq .
If the node has a taint and the pod doesn’t have a matching toleration, the scheduler will skip that node.
Node selectors and affinity
# Check what the pod requires
kubectl get pod <pod-name> -o jsonpath='{.spec.nodeSelector}' | jq .
kubectl get pod <pod-name> -o jsonpath='{.spec.affinity}' | jq .

# Check what nodes have
kubectl get nodes --show-labels | grep <expected-label>
If the pod requires gpu-type=a100 but no node has that label, the pod stays Pending forever.
PersistentVolumeClaim binding
kubectl get pvc -n <namespace>
If the PVC status is Pending, the pod can’t start because its storage isn’t ready. Check the PVC events:
kubectl describe pvc <pvc-name> -n <namespace> | grep -A10 "Events"
The signal to move to Layer 3
If the pod is Running but the service isn’t working (requests fail, connections time out, DNS doesn’t resolve), the problem is networking. Move to Layer 3.
Layer 3: Networking
The pod is running. The application is healthy. But traffic isn’t reaching it. Or it can’t reach other services.
Service connectivity
First, verify the service exists and has endpoints:
# Check the service
kubectl get svc <service-name> -n <namespace>

# Check if the service has endpoints (pods backing it)
kubectl get endpoints <service-name> -n <namespace>
If endpoints shows zero addresses, the service selector doesn’t match any running pods. Compare the service selector with the pod labels:
# Service selector
kubectl get svc <service-name> -o jsonpath='{.spec.selector}'

# Pod labels
kubectl get pods -n <namespace> --show-labels
DNS resolution
The most common networking issue in Kubernetes. The pod can’t resolve service names.
# Test DNS from inside a pod
kubectl exec -it <pod-name> -- nslookup <service-name>
kubectl exec -it <pod-name> -- nslookup <service-name>.<namespace>.svc.cluster.local
If DNS fails, check CoreDNS:
# Is CoreDNS running?
kubectl get pods -n kube-system -l k8s-app=kube-dns

# CoreDNS logs
kubectl logs -n kube-system -l k8s-app=kube-dns --tail=50
A common cause of slow DNS is the ndots setting. By default, Kubernetes adds ndots:5 to resolv.conf, which means any name with fewer than 5 dots gets appended with search domains before the actual lookup. A simple lookup for api.example.com generates 4 failed queries before the real one succeeds.
The fix:
spec:
  dnsConfig:
    options:
      - name: ndots
        value: "2"
Network policies
If you have network policies in your cluster, they might be blocking traffic between pods.
# List network policies in the namespace
kubectl get networkpolicies -n <namespace>

# Describe a specific policy
kubectl describe networkpolicy <policy-name> -n <namespace>
A missing egress rule means the pod can’t make outbound connections. A missing ingress rule means nothing can connect to the pod. An empty pod selector {} applies to all pods in the namespace.
Testing connectivity
# Test pod to pod connectivity
kubectl exec -it <pod-a> -- curl -v http://<pod-b-ip>:<port>

# Test pod to service connectivity
kubectl exec -it <pod-a> -- curl -v http://<service-name>:<port>

# Test pod to external connectivity
kubectl exec -it <pod-a> -- curl -v https://httpbin.org/get
The signal to move to Layer 4
If all pods are slow (not just one service), if kubectl itself is slow, or if you see etcdserver: request timed out in logs, the problem is the control plane. Move to Layer 4.
Layer 4: Cluster Infrastructure
The control plane is degraded. This affects everything in the cluster, not just one application.
Symptoms
kubectl commands take 5+ seconds. Deployments don’t roll out. Pod creation is delayed. Controller reconciliation falls behind. Events show etcdserver: request timed out.
API server health
# Check API server response time
time kubectl get nodes

# Check API server metrics (if accessible)
kubectl get --raw /metrics | grep apiserver_request_duration_seconds

# Check API server logs
kubectl logs -n kube-system kube-apiserver-<node> --tail=50
If the API server is slow, the cause is almost always etcd. The API server is stateless. etcd is not.
etcd health
# Quick health check
etcdctl endpoint health --cluster \
  --endpoints=https://127.0.0.1:2379 \
  --cacert=/etc/kubernetes/pki/etcd/ca.crt \
  --cert=/etc/kubernetes/pki/etcd/server.crt \
  --key=/etc/kubernetes/pki/etcd/server.key

# Detailed status
etcdctl endpoint status --write-out=table --cluster \
  --endpoints=https://127.0.0.1:2379 \
  --cacert=/etc/kubernetes/pki/etcd/ca.crt \
  --cert=/etc/kubernetes/pki/etcd/server.crt \
  --key=/etc/kubernetes/pki/etcd/server.key
Check the metrics that predict etcd failures:
etcd_disk_wal_fsync_duration_seconds p99 above 10ms means disk latency. etcd_mvcc_db_total_size_in_bytes approaching the quota means NOSPACE is coming. etcd_server_leader_changes_seen_total above 1 per hour means instability.
We covered all five etcd failure modes in detail in our etcd debugging guide.
Certificate expiry
kubeadm certs check-expiration
If certificates expire, everything breaks at once. Existing pods keep running from kubelet cache. But nothing new can be created, updated, or deleted.
Scheduler health
# Check scheduler logs
kubectl logs -n kube-system kube-scheduler-<node> --tail=30

# Check if scheduler is falling behind
kubectl get --raw /metrics | grep scheduler_scheduling_attempt_duration_seconds
The signal to move to Layer 5
If specific nodes show problems (NotReady status, high resource usage, kubelet errors) but the control plane is healthy, the issue is at the node level. Move to Layer 5.
Layer 5: Node and Hardware
Individual nodes are unhealthy. This only affects pods running on those specific nodes.
Node status
# Check all node statuses
kubectl get nodes

# Look for conditions on a specific node
kubectl describe node <node-name> | grep -A10 "Conditions"
The Conditions section shows:
MemoryPressure: the node is running out of RAM. DiskPressure: the node is running out of disk. PIDPressure: the node has too many processes. Ready: False means the kubelet can’t communicate with the API server.
Kubelet health
# Check kubelet status on the node
systemctl status kubelet

# Kubelet logs
journalctl -u kubelet --tail=50
Common kubelet issues: certificate expired, container runtime not responding, disk full on the node.
GPU specific issues
For GPU nodes, check the GPU Operator components:
# Are all GPU Operator pods running?
kubectl get pods -n gpu-operator -o wide

# Can the node see GPUs?
kubectl describe node <gpu-node> | grep nvidia.com/gpu

# Check nvidia-smi on the node
kubectl debug node/<gpu-node> -it --image=nvidia/cuda:12.0-base -- nvidia-smi
If nvidia-smi fails, the GPU driver isn’t loaded. Check the driver container in the GPU Operator.
We covered the full GPU Operator debugging path in our GPU Operator article.
Disk pressure
# Check disk usage on the node
kubectl debug node/<node> -it --image=ubuntu -- df -h

# Check container image storage
kubectl debug node/<node> -it --image=ubuntu -- du -sh /var/lib/containerd
Old container images and unused layers accumulate over time. Kubernetes garbage collection should handle this, but sometimes it falls behind.
The Quick Reference Checklist
When something breaks in production, run through this sequence:
1. kubectl get pods -n <namespace>
   → What state are the affected pods in?

2. If CrashLoopBackOff or Error:
   → kubectl logs <pod> --previous --tail=100
   → Layer 1: Application issue

3. If Pending:
   → kubectl describe pod <pod> (read Events)
   → Layer 2: Scheduling issue

4. If Running but not working:
   → kubectl exec <pod> -- curl <service>
   → kubectl exec <pod> -- nslookup <service>
   → Layer 3: Networking issue

5. If everything is slow:
   → time kubectl get nodes
   → etcdctl endpoint health --cluster
   → Layer 4: Control plane issue

6. If specific node problems:
   → kubectl describe node <node> (check Conditions)
   → systemctl status kubelet
   → Layer 5: Node/hardware issue
This sequence takes 2 minutes. It eliminates 80% of possible causes and points you at the right layer immediately. No more guessing.
The Debugging Mindset
Three rules that make debugging faster:
Rule 1: Read the Events. Every kubectl describe output has an Events section. Read it. From bottom to top. The events tell you what Kubernetes already knows about the problem. Most engineers skip this and start guessing.
Rule 2: Check one layer at a time. Don’t jump between application logs, network policies, and etcd metrics in the same debugging session. Start at Layer 1. If the evidence points to a different layer, move there deliberately. Randomized debugging wastes time.
Rule 3: Reproduce before you fix. If you can’t reproduce the problem on demand, you don’t understand it yet. A fix applied without understanding the root cause is just a workaround that will break again later.
What This Framework Connects To
This article is the anchor for production debugging at KubeNatives. Every specific debugging guide links back here:
Our etcd debugging guide covers Layer 4 in depth: the 5 ways etcd breaks and the metrics that predict each failure.
Our GPU Operator article covers Layer 5 for GPU nodes: the 8 components and the initialization dependency chain.
Our DNS troubleshooting guide (coming soon) will cover Layer 3 in depth: CoreDNS, ndots, and the 5 second timeout problem.
Each supporting article gives you the deep dive for a specific problem. This framework tells you which article to reach for.
Next week: Deploying vLLM on Kubernetes: From Single Pod to Production.
If you’re running production Kubernetes, I cover control plane operations, GPU infrastructure, and model serving every week. Subscribe at kubenatives.com.