
Scaling Patterns: Your Guide to Vertical, Horizontal & Functional Sharding
How to Scale Your Database and Infrastructure: Master Vertical, Horizontal, and Functional Sharding Patterns.

Introduction
Think of your application like a restaurant. When more customers arrive, you have three choices: get a bigger kitchen (vertical), open multiple locations (horizontal), or specialize each location for different cuisines (functional sharding). Let’s explore how these strategies work in the tech world.
Vertical Scaling (Scaling Up)
The Simple Explanation: Vertical scaling is like upgrading from a bicycle to a motorcycle—same rider, more power.
What Actually Happens: You’re adding resources to a single machine:
CPU: 4 cores → 16 cores → 64 cores
RAM: 8GB → 32GB → 128GB
Storage: HDD → SSD → NVMe SSD
Network: 1 Gbps → 10 Gbps → 100 Gbps
Technical Deep Dive:
Before Vertical Scaling:
Single Database Server:
├── CPU: 4 cores @ 2.5 GHz
├── RAM: 16 GB
├── Storage: 500 GB SSD
└── Handles: ~1,000 req/sec
After Vertical Scaling:
Upgraded Database Server:
├── CPU: 32 cores @ 3.5 GHz
├── RAM: 128 GB
├── Storage: 2 TB NVMe SSD
└── Handles: ~8,000 req/sec
The Math Behind It:
Query performance: More RAM = more data cached in memory = faster queries
Connection handling: More CPU cores = more concurrent connections (typically 100-200 connections per core)
I/O throughput: NVMe drives can handle 3-7 GB/s vs. SATA SSD at 550 MB/s
When Your Metrics Tell You to Scale Up:
CPU usage consistently > 80%
Memory usage > 85% with frequent swapping
Disk I/O wait times > 10%
Query response times increasing linearly with load
Real Implementation Example:
-- Before: Query takes 2.5 seconds
SELECT * FROM orders
WHERE customer_id = 12345
AND order_date > ‘2024-01-01’;

-- After vertical scaling (more RAM for indexes):
-- Same query takes 0.3 seconds
-- Why? The entire index now fits in memory
The Hidden Limit: AWS largest instance (u-24tb1.112xlarge): 448 vCPUs, 24 TB RAM, ~$200,000/month. That’s your ceiling.
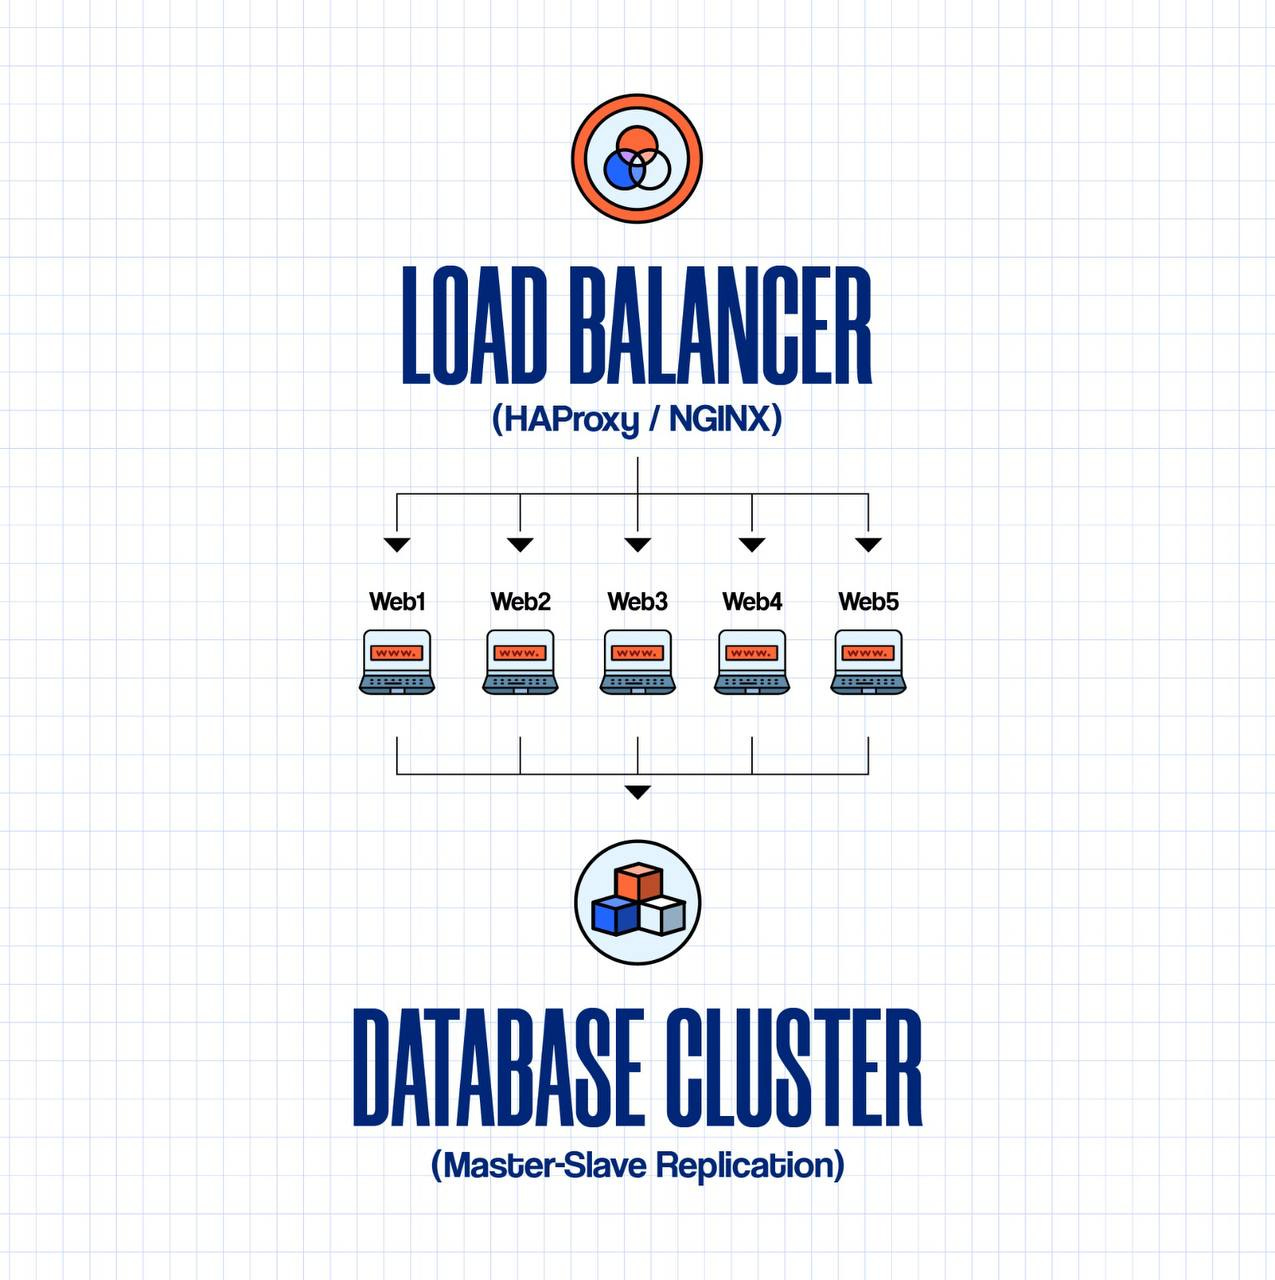
Horizontal Scaling (Scaling Out)
The Simple Explanation: Instead of one super-powerful restaurant, you open 10 regular restaurants across the city. Each handles their neighborhood’s orders.
What Actually Happens: You distribute workload across multiple machines working together.
Technical Deep Dive:
Architecture Pattern:
Three Ways to Implement Horizontal Scaling:
1. Application Layer (Stateless Servers)
// Before: Single server handles everything
Server1: handles all 10,000 users

// After: Load balanced across 5 servers
Server1: handles 2,000 users
Server2: handles 2,000 users
Server3: handles 2,000 users
Server4: handles 2,000 users
Server5: handles 2,000 users

// Each server runs identical code
// Sessions stored in Redis (shared state)
2. Database Read Replicas
Master DB (Writes)
    ├── Handles: INSERT, UPDATE, DELETE
    └── Replicates to ↓

Read Replica 1 ──┐
Read Replica 2  ─┼── Each handles: SELECT queries
Read Replica 3 ──┘

Traffic Split:
- 20% writes → Master
- 80% reads → Distributed across replicas
3. Data Sharding (Range-based)
User ID Range Sharding:

Shard 1 (Server A): user_id 1 - 1,000,000
Shard 2 (Server B): user_id 1,000,001 - 2,000,000
Shard 3 (Server C): user_id 2,000,001 - 3,000,000

Query routing logic:
if (user_id <= 1000000) → Shard 1
else if (user_id <= 2000000) → Shard 2
else → Shard 3
The Consistency Challenge:
CAP Theorem in Practice: You can only guarantee 2 of 3:
Consistency: All nodes see the same data
Availability: Every request gets a response
Partition Tolerance: System works despite network failures
// Example: Eventual consistency problem

// User updates profile on Server 1
Server1.update({name: “John Doe”}) // timestamp: 10:00:00

// Replication lag = 2 seconds
// User reads from Server 2 at 10:00:01
Server2.read() // Returns old name: “John D.”

// At 10:00:02, replication completes
Server2.read() // Now returns: “John Doe”
Load Balancing Algorithms:
Round Robin: Request 1 → Server A, Request 2 → Server B, Request 3 → Server C
Least Connections: Send to the server with the fewest active connections
IP Hash: Same user always goes to the same server (sticky sessions)
Weighted: Server with 2x capacity gets 2x traffic
Real Metrics:
Single server: 1,000 req/sec, 99th percentile = 200ms
5 servers (horizontal): 5,000 req/sec, 99th percentile = 180ms
10 servers: 10,000 req/sec, 99th percentile = 175ms
Functional Sharding (Partitioning by Function)
The Simple Explanation: Instead of one restaurant serving everything, you have a pizza place, a sushi bar, and a steakhouse—each specializing in what they do best.
What Actually Happens: Different databases handle different business domains, each scaled independently.
Technical Deep Dive:
Monolithic Architecture (Before):
Single Database:
├── users table (5 GB)
├── products table (50 GB)
├── orders table (200 GB)
├── reviews table (30 GB)
├── analytics_logs table (500 GB)
└── Total: 785 GB, all competing for same resources
Functionally Sharded Architecture (After):
User Service
├── users_db (PostgreSQL)
│   ├── users table
│   ├── auth_tokens table
│   ├── Size: 5 GB
│   └── Optimized: Fast lookups, high availability

Product Service
├── products_db (PostgreSQL + ElasticSearch)
│   ├── products table
│   ├── categories table
│   ├── Size: 50 GB
│   └── Optimized: Full-text search, caching

Order Service
├── orders_db (PostgreSQL + TimescaleDB)
│   ├── orders table
│   ├── order_items table
│   ├── Size: 200 GB
│   └── Optimized: Time-series queries, partitioning

Analytics Service
├── analytics_db (ClickHouse/Cassandra)
│   ├── events table
│   ├── Size: 500 GB
│   └── Optimized: Write-heavy, column-oriented
Cross-Service Communication:
Problem: How do you join data across services?
Bad Approach (Database joins across services):
Good Approach 1 (API Composition):
Good Approach 2 (Event-Driven Data Replication):
Distributed Transactions Problem:
Scenario: Processing an order requires:
Charge payment → Payment Service
Reserve inventory → Inventory Service
Create order → Order Service
Solution: Saga Pattern
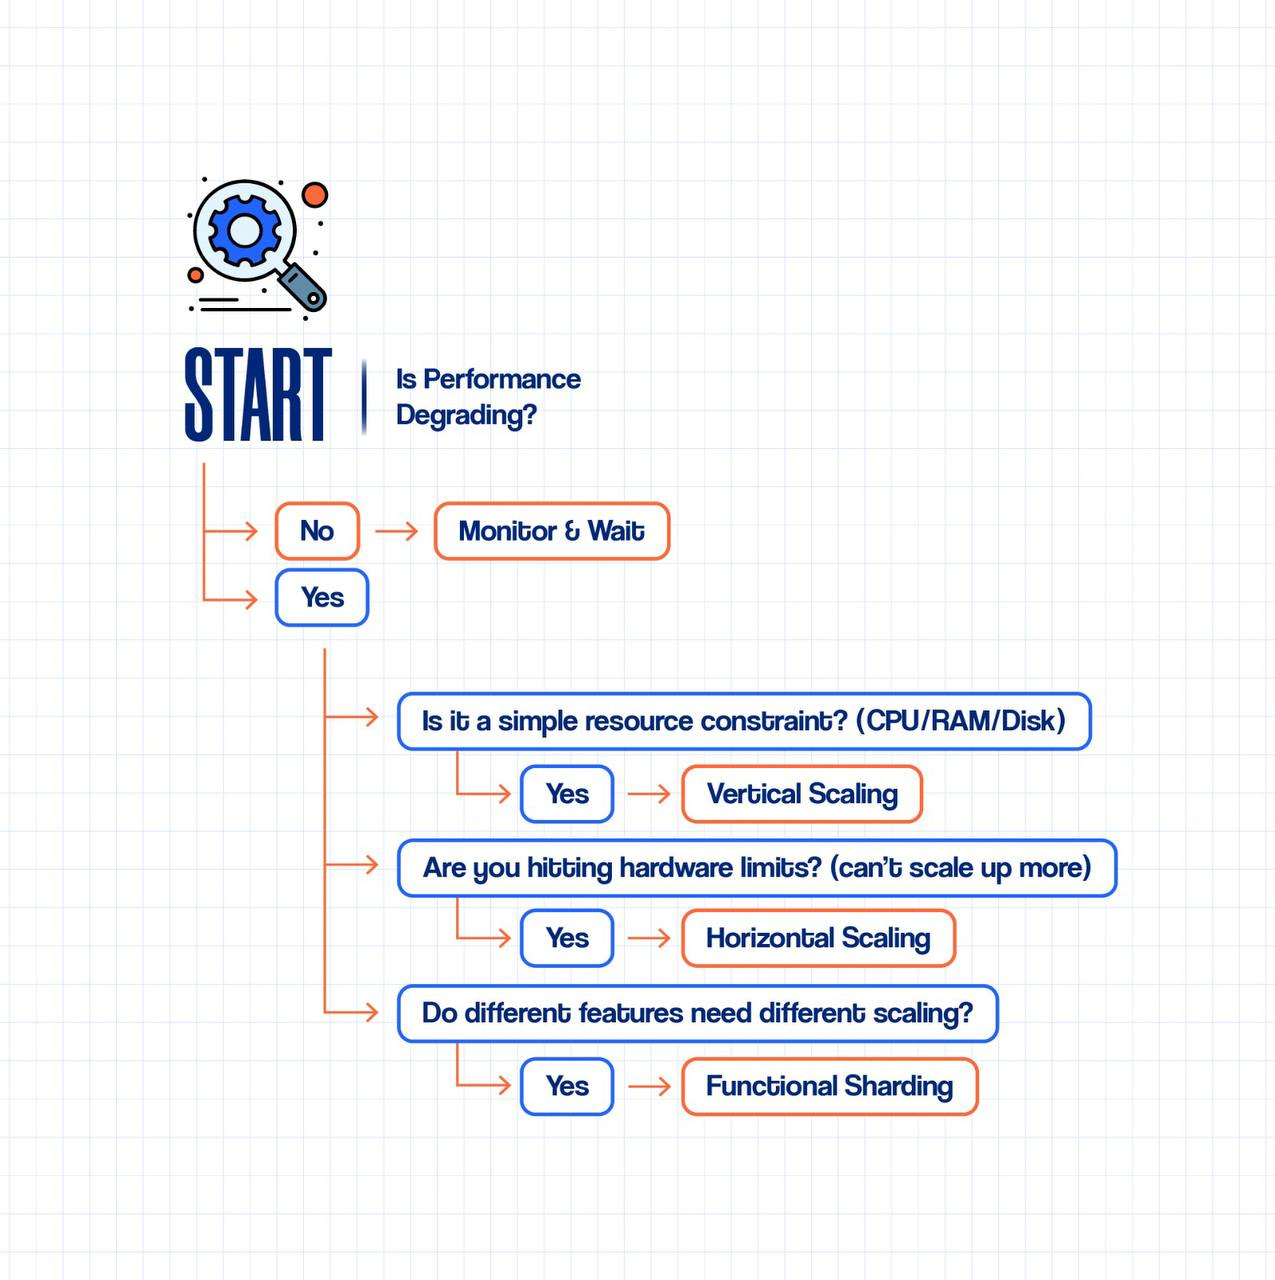
Decision Framework: Which Pattern to Choose?
Use this flowchart approach:
Real-World Scaling Timeline:
Phase 1: Startup (0-10K users)
Single server with vertical scaling
Cost: $200-500/month
Why: Simplicity, fast iteration
Phase 2: Growth (10K-100K users)
Horizontal scaling for web/app tier
Database read replicas
Cost: $2K-5K/month
Why: Need availability, growing traffic
Phase 3: Scale (100K-1M users)
Full horizontal scaling
Database sharding
CDN, caching layers
Cost: $10K-50K/month
Why: Performance, global reach
Phase 4: Enterprise (1M+ users)
Functional sharding (microservices)
Multi-region deployment
Specialized databases per service
Cost: $100K+/month
Why: Team scale, feature velocity
Advanced Pro Tips
1. Measure First, Scale Second
// Key metrics to track:
{
  “cpu_usage”: “75%”,          // Scale at 80%
  “memory_usage”: “82%”,       // Scale at 85%
  “disk_io_wait”: “15%”,       // Scale at 10%
  “query_p95_latency”: “250ms”, // Scale if > 200ms
  “error_rate”: “0.1%”,        // Scale if > 0.5%
  “requests_per_second”: 8500  // Know your limits
}
2. Database Sharding Key Selection
Bad Sharding Key:
-- Date-based sharding (creates hotspots)
Shard by month:
├── January 2025 → Shard 1 (inactive, mostly reads)
└── October 2025 → Shard 10 (all writes, overloaded!)
Good Sharding Key:
-- Hash-based sharding (even distribution)
Shard by user_id hash:
├── hash(user_id) % 10 = 0 → Shard 0 (10% traffic)
├── hash(user_id) % 10 = 1 → Shard 1 (10% traffic)
└── ... evenly distributed
3. Caching Strategy by Scale Pattern
Vertical Scaling:
└── In-memory cache (Redis on same server)

Horizontal Scaling:
├── Distributed cache (Redis Cluster)
└── CDN for static assets

Functional Sharding:
├── Service-level caches (each service has own Redis)
└── Shared cache for cross-service data
4. Cost Comparison (Real Numbers)
10,000 requests/second scenario:
Option A: Vertical Scaling
1 × EC2 m6i.16xlarge
├── 64 vCPU, 256 GB RAM
├── Cost: $2,458/month
└── Single point of failure
Option B: Horizontal Scaling
10 × EC2 m6i.xlarge behind ALB
├── Each: 4 vCPU, 16 GB RAM
├── Cost: $1,536/month (servers) + $50 (load balancer)
└── High availability ✓
Winner: Horizontal (cheaper + more resilient)
Real-World Case Studies
Case Study 1: E-commerce Platform
Start: 1 server, 1,000 orders/day
Problem: Black Friday → 50,000 orders/day
Solution:
Horizontal scaling: 15 web servers
Functional sharding: Separated product catalog from order processing
Result: Handled 100,000 orders/day, 99.9% uptime
Case Study 2: SaaS Analytics Platform
Start: Monolithic database, 5 GB
Problem: Analytics queries blocking user transactions
Solution:
Functional sharding: Separate OLTP (PostgreSQL) from OLAP (ClickHouse)
Result: User queries <50ms, analytics unlimited complexity
Action Plan
Week 1: Measure
Set up monitoring (Prometheus, Grafana, Datadog)
Establish baseline metrics
Identify bottlenecks
Week 2-3: Quick Wins
Vertical scale if under hardware limits
Add caching layer
Optimize queries
Month 2-3: Horizontal Scaling
Implement load balancing
Set up read replicas
Test failover scenarios
Month 4-6: Functional Sharding (if needed)
Identify service boundaries
Extract microservices one at a time
Implement event-driven architecture
Conclusion
Scaling isn’t about choosing one pattern—it’s about combining them intelligently. Start simple (vertical), grow smart (horizontal), and specialize when necessary (functional sharding). The best architecture is one your team can understand, operate, and debug at 3 AM.
Remember: Premature optimization is the root of all evil, but so is ignoring scaling until your servers melt.