
The OSI Model: Not Academic BS - Here's Why It Matters in Production
How understanding the OSI layers saved me 4 hours of debugging and prevented a customer-facing outage


3:47 AM. Slack notifications exploding. Our entire Kubernetes cluster was unreachable.
"Network is fine," said the network team.
"Pods are running," said the platform team.
"Load balancer looks good," said the infrastructure team.
Yet customers couldn't access our services. Revenue was bleeding.
For two hours, we played the blame game. The network team pointed fingers at Kubernetes. The platform team blamed the load balancer. Everyone was looking at their layer without understanding how they connected.
Then I remembered something from my early networking days - the OSI model. Not the academic memorization drill, but the systematic debugging framework it provides.
Within 15 minutes, I identified the issue using the OSI Model.
That night taught me the most important lesson of my DevOps career: The OSI model isn't academic theory - it's the debugging superpower that separates senior engineers from everyone else.
Why Most Engineers Get the OSI Model Wrong
Here's what they teach you in networking courses:
"The OSI model has 7 layers: Physical, Data Link, Network, Transport, Session, Presentation, Application. Memorize them for the exam."
Completely useless for production environments.
Here's what they should teach you:
"The OSI model is a systematic troubleshooting framework that helps you isolate network issues in complex distributed systems by working layer by layer."
Game-changing for real-world debugging.
The OSI Model: Production Engineer's Edition
Forget the textbook definitions. Here's what each layer actually means when your production system is on fire:
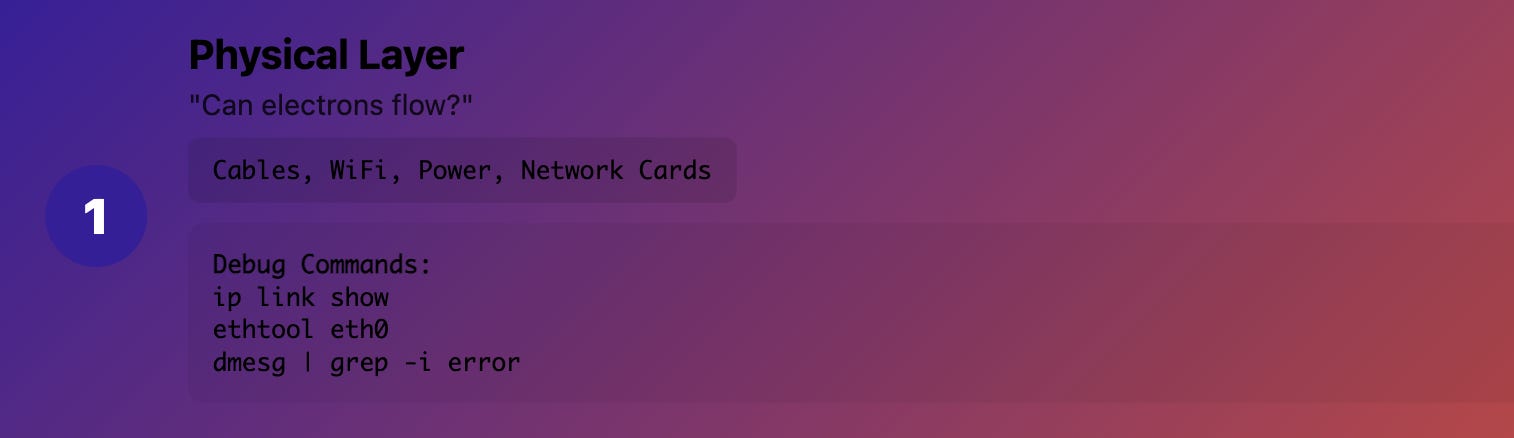
Layer 1 (Physical): "Can electrons flow?"
What it really means: Cables, fiber, WiFi signals, power Production reality: The stuff you can physically touch
Common issues:
Unplugged cables (yes, even in 2025)
Bad network interfaces
Power outages
Fiber cuts
Debug commands:
# Check interface status
ip link show

# Check if interface is receiving packets
ethtool eth0

# Look for hardware errors
dmesg | grep -i error
Real example: "Kubernetes node went NotReady" → turned out someone unplugged the server's network cable during maintenance.
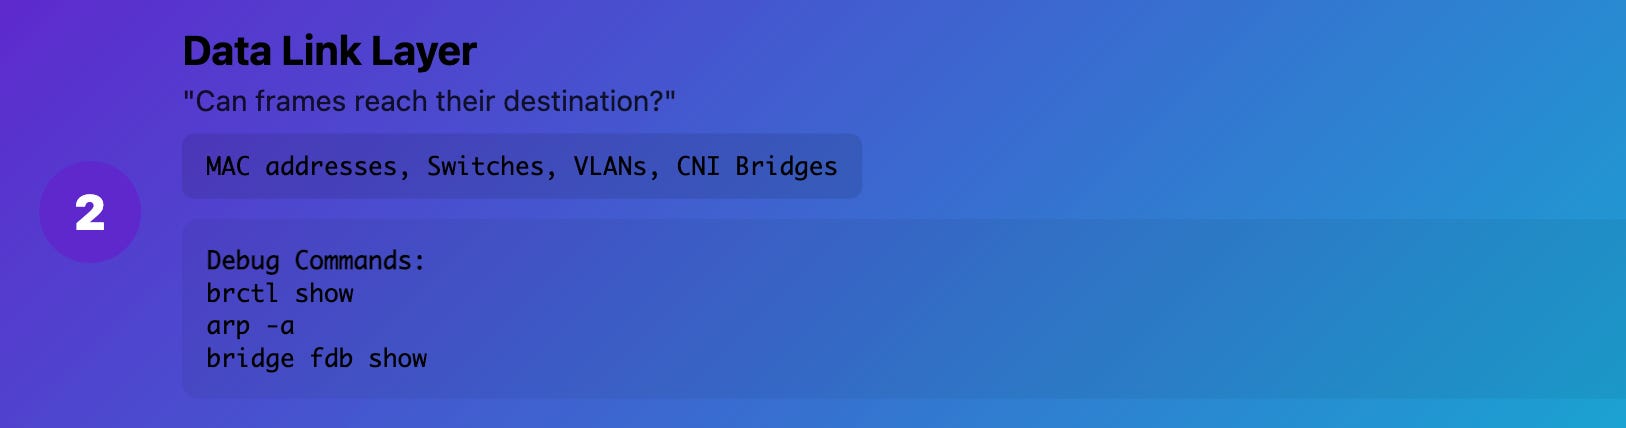
Layer 2 (Data Link): "Can frames reach their destination?"
What it really means: MAC addresses, switches, VLANs, bridges Production reality: How devices talk to each other on the same network segment
Common Kubernetes issues:
CNI bridge misconfiguration
VLAN problems between nodes
MAC address conflicts
Bridge forwarding issues
Debug commands:
# Check bridge configuration
brctl show

# Look at ARP table
arp -a

# Check VLAN configuration
cat /proc/net/vlan/config

# Check bridge forwarding
bridge fdb show
Real example: Pods on different nodes couldn't communicate because the CNI bridge wasn't forwarding Layer 2 frames correctly between VLANs.
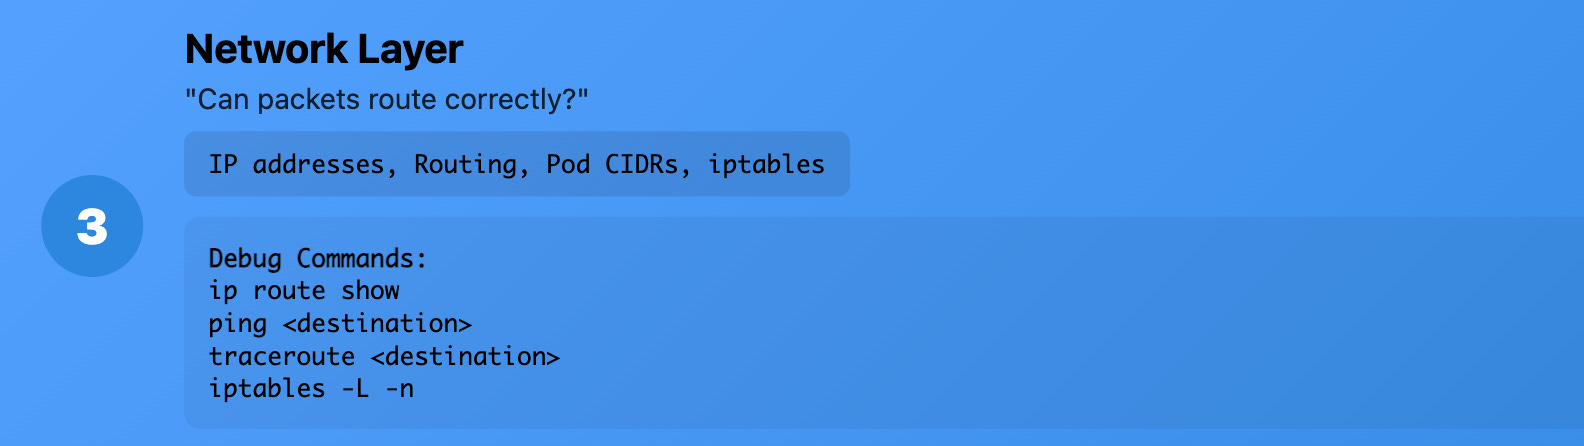
Layer 3 (Network): "Can packets route correctly?"
What it really means: IP addresses, routing, subnets Production reality: How packets find their way across networks
Common Kubernetes issues:
Pod CIDR conflicts
Route table problems
IP address exhaustion
Firewall rules blocking traffic
Debug commands:
# Check routing table
ip route show

# Test IP connectivity
ping <destination>

# Trace packet path
traceroute <destination>

# Check iptables rules
iptables -L -n
Real example: New pod subnet overlapped with the corporate network range, causing routing conflicts that broke service discovery.
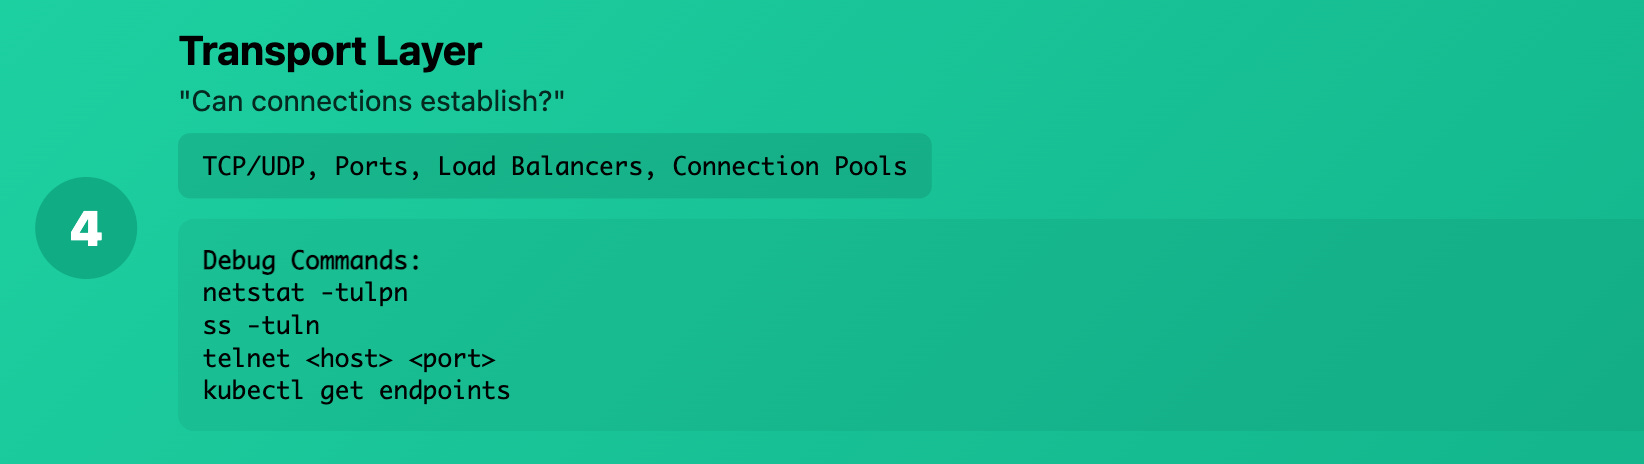
Layer 4 (Transport): "Can connections establish?"
What it really means: TCP/UDP ports, connection state Production reality: Whether your services can actually establish connections
Common Kubernetes issues:
Port conflicts
Connection pool exhaustion
Load balancer health check failures
TCP timeouts
Debug commands:
# Check listening ports
netstat -tulpn

# Check connection states
ss -tuln

# Test port connectivity
telnet <host> <port>

# Check connection limits
cat /proc/sys/net/core/somaxconn
Real example: Database connections were failing because the connection pool was exhausted, but Layer 3 connectivity was perfect.
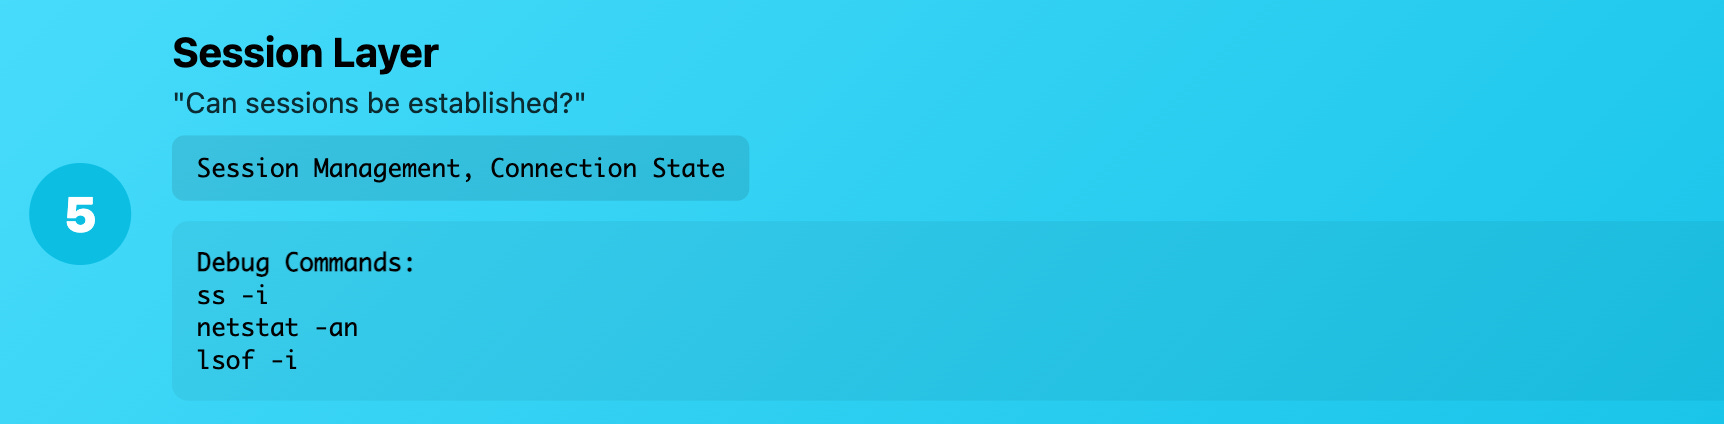
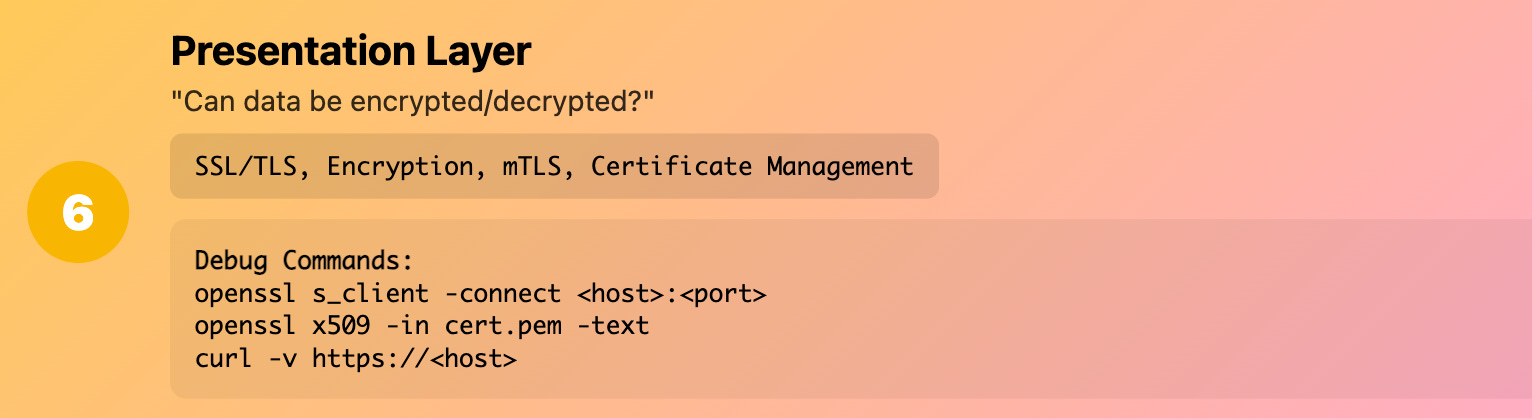
Layer 5-6 (Session/Presentation): "Can applications negotiate?"
What it really means: SSL/TLS, encryption, session management
Production reality: The crypto and session stuff that usually "just works" until it doesn't
Common Kubernetes issues:
TLS handshake failures
Certificate problems
Encryption protocol mismatches
Session persistence issues
Debug commands:
# Test TLS connection
openssl s_client -connect <host>:<port>

# Check certificate details
openssl x509 -in cert.pem -text

# Debug TLS handshake
curl -v https://<host>
Real example: Service mesh mTLS was failing because certificates had the wrong SAN (Subject Alternative Name) for the service discovery names.
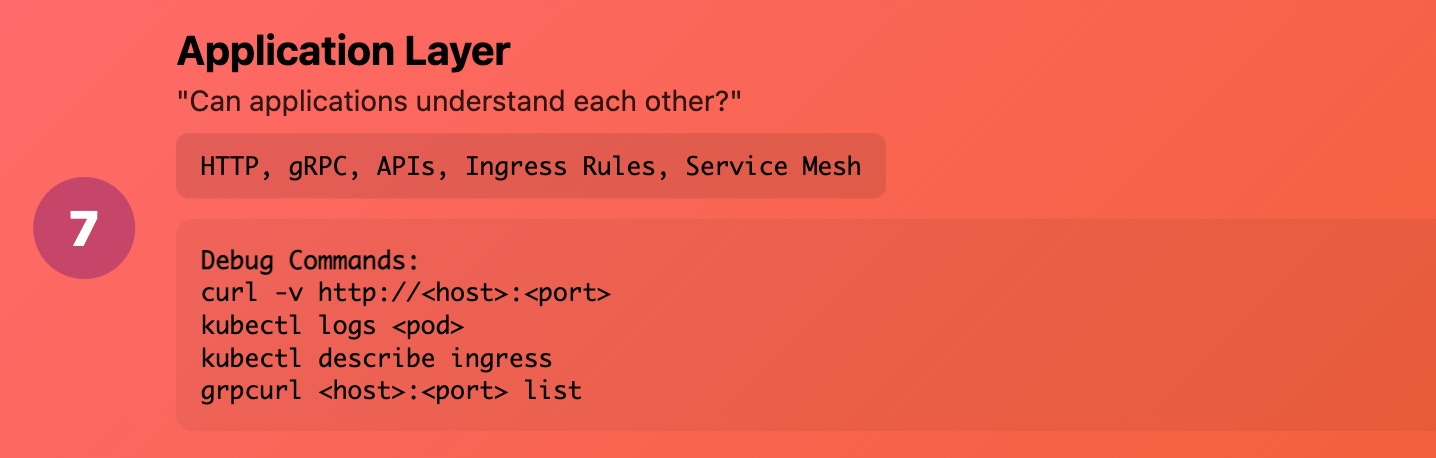
Layer 7 (Application): "Can applications understand each other?"
What it really means: HTTP, gRPC, database protocols Production reality: Your actual application logic and APIs
Common Kubernetes issues:
HTTP 404/500 errors
API version mismatches
Load balancer routing rules
Application-level authentication
Debug commands:
# Test HTTP connectivity
curl -v http://<host>:<port>/health

# Check application logs
kubectl logs <pod>

# Test gRPC connectivity
grpcurl <host>:<port> list

# Check ingress routing
kubectl describe ingress <name>
Real example: Users were getting 503 errors because the ingress controller couldn't find the backend service - not a network issue, but an application routing configuration problem.
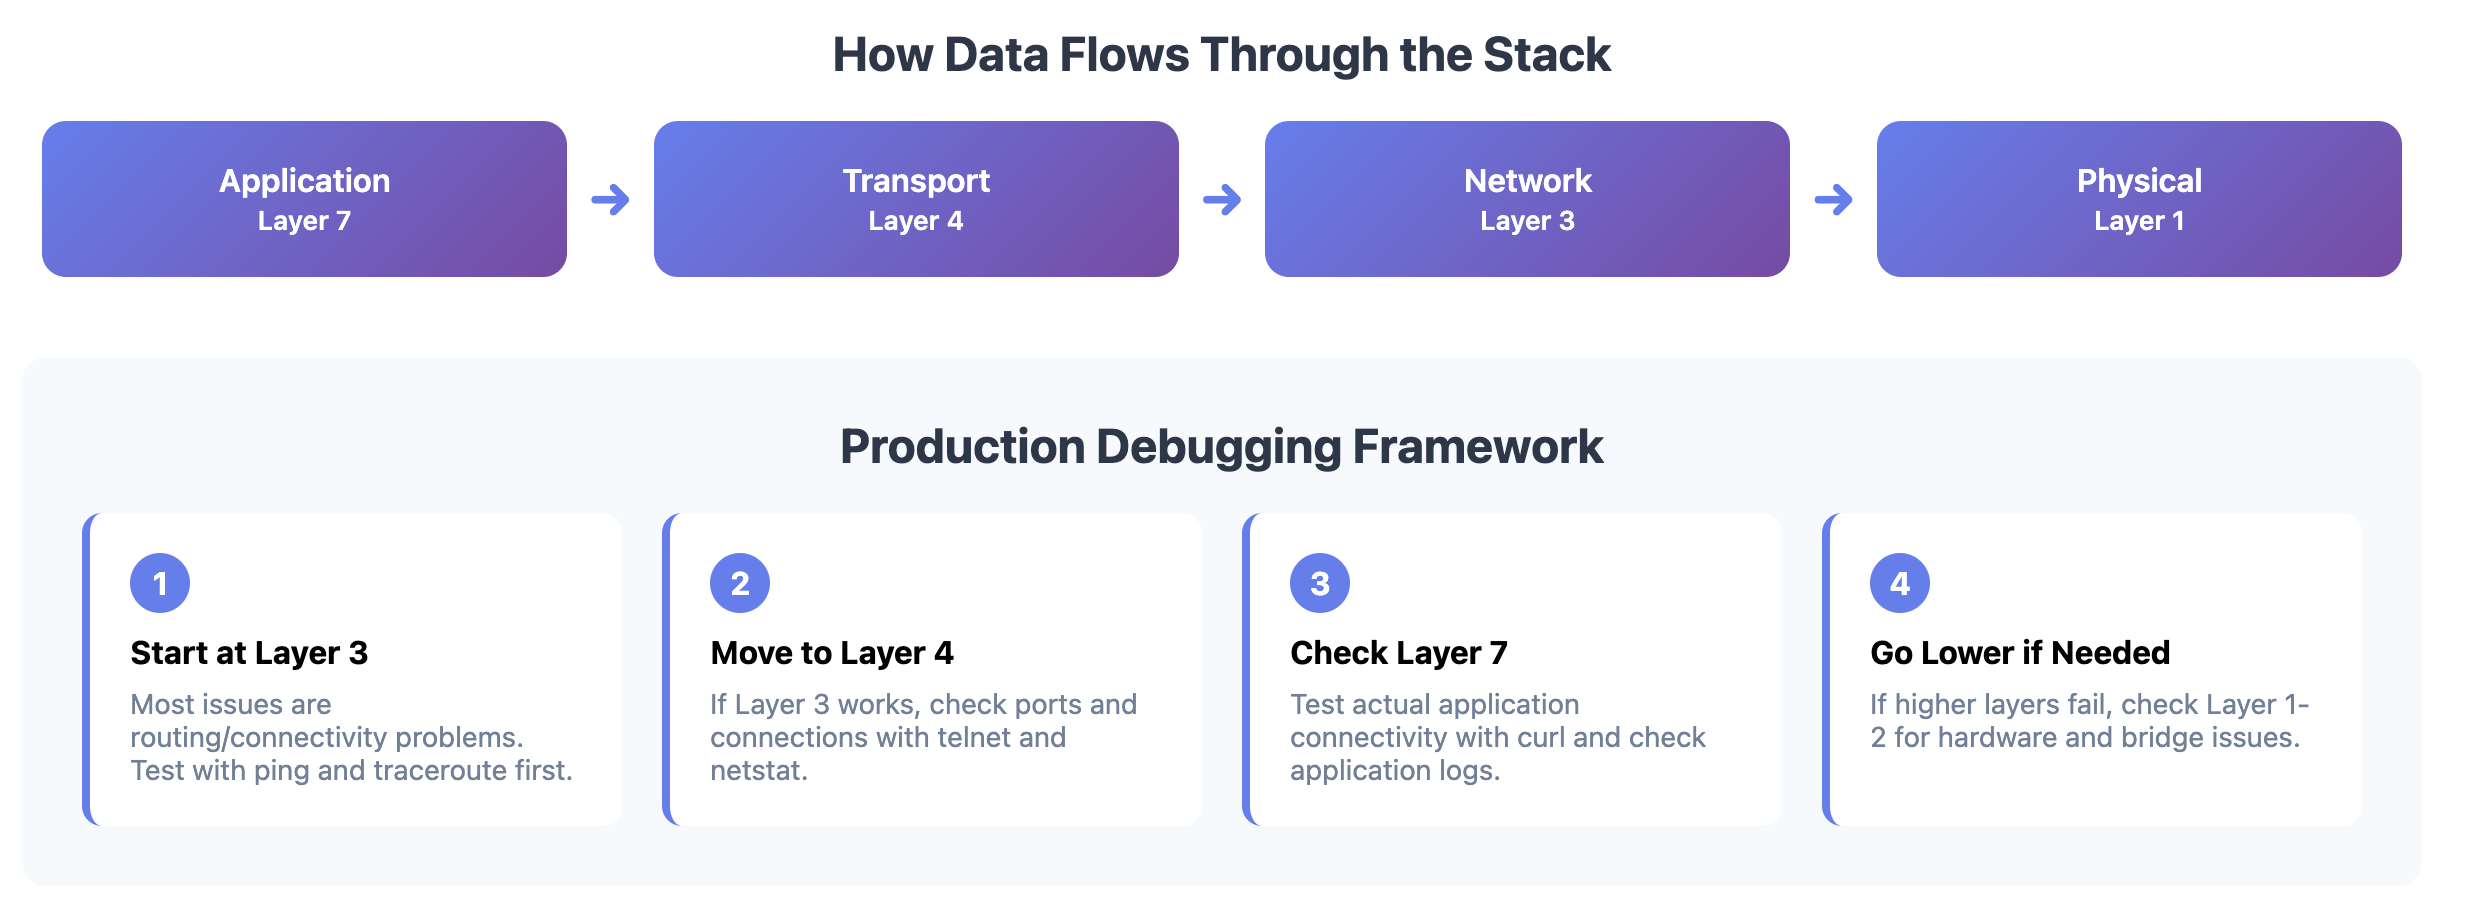
The Production Debugging Framework
When something breaks in production, work through the layers systematically:
1. Start at Layer 3 (Most Common Issues)
# Can I reach the destination IP?
ping <service-ip>

# Are packets routing correctly?
traceroute <service-ip>

# What does the routing table look like?
ip route show
2. Move to Layer 4 (Connection Issues)
# Is the port actually open?
telnet <service-ip> <port>

# What's listening on this node?
netstat -tulpn | grep <port>

# Are there connection errors?
ss -i
3. Check Layer 7 (Application Level)
# Can I make an actual application request?
curl -v http://<service>:<port>/health

# What do the application logs say?
kubectl logs <pod> --tail=100
4. Go Lower if Needed (Layers 1-2)
# Is the network interface up?
ip link show

# Are we getting Layer 2 connectivity?
arp -a | grep <ip>

# Any hardware issues?
dmesg | grep -i error
Real-World Debugging Stories
Story 1: The Mysterious Pod Communication Failure
Symptoms: Pods couldn't reach each other across nodes
Layer 7: Application logs showed "connection refused"
Layer 4: telnet to pod IP failed
Layer 3: ping to pod IP failed
Layer 2: FOUND IT - CNI wasn't creating the bridge properly
Root cause: CNI configuration had the wrong bridge name
Fix time: 10 minutes once we found the right layer
Without OSI thinking: Would have taken hours of random troubleshooting
Story 2: The Load Balancer That Wasn't
Symptoms: External users getting timeouts
Layer 7: Curl to service URL failed
Layer 4: FOUND IT - Load balancer health checks were failing
Root cause: Health check endpoint returned wrong HTTP status code
Fix time: 5 minutes
Without OSI thinking: We were debugging networking when it was application logic
Story 3: The Database That Disappeared
Symptoms: Applications couldn't connect to database
Layer 7: Application logs showed "connection refused"
Layer 4: FOUND IT - Database wasn't listening on expected port
Root cause: Database config changed the listening port during upgrade
Fix time: 2 minutes to identify, 5 minutes to fix
Without OSI thinking: Would have spent time debugging network when it was configuration
OSI Model for Common Kubernetes Scenarios
Debugging Service Discovery Issues
# Layer 7: Can I resolve the service name?
nslookup my-service.default.svc.cluster.local

# Layer 4: Is the service listening?
kubectl get endpoints my-service

# Layer 3: Can I reach the pod directly?
kubectl exec -it debug-pod -- ping <pod-ip>
Debugging Ingress Problems
# Layer 7: Is the ingress routing correctly?
curl -H "Host: myapp.com" http://<ingress-ip>/

# Layer 4: Is the ingress controller healthy?
kubectl get pods -n ingress-nginx

# Layer 3: Can I reach the backend service?
kubectl exec -it debug-pod -- curl http://my-service/health
Debugging CNI Issues
# Layer 3: Are pod CIDRs configured correctly?
kubectl get nodes -o wide

# Layer 2: Is the CNI creating bridges?
brctl show

# Layer 1: Are network interfaces up?
ip link show
The Mental Framework That Changes Everything
Before OSI thinking:
Random troubleshooting
Blame game between teams
Hours of trial and error
"Let's restart everything and see"
After OSI thinking:
Systematic layer-by-layer debugging
Clear communication: "It's a Layer 4 issue"
Rapid problem isolation
Targeted fixes instead of random restarts
Pro Tips for Using OSI in Production
1. Always Communicate the Layer
Instead of: "The network is broken" Say: "We have a Layer 2 forwarding issue between VLANs"
2. Build Tools for Each Layer
# Layer 3 toolkit
alias check-routing='ip route show'
alias check-connectivity='ping -c3'

# Layer 4 toolkit
alias check-ports='netstat -tulpn'
alias test-connection='telnet'

# Layer 7 toolkit
alias check-http='curl -v'
alias check-dns='nslookup'
3. Document Layer-Specific Runbooks
Layer 1-2 issues: Contact network team
Layer 3 issues: Check routing, firewall rules
Layer 4 issues: Check service configuration, ports
Layer 7 issues: Check application logs, configuration
4. Monitor Each Layer
# Prometheus metrics for different layers
- node_network_up # Layer 1
- node_network_receive_packets_total # Layer 2
- probe_icmp_duration_seconds # Layer 3
- probe_tcp_duration_seconds # Layer 4
- probe_http_duration_seconds # Layer 7
Common Kubernetes Issues by OSI Layer
Layer 1-2 (Infrastructure)
Node network interfaces down
CNI bridge misconfiguration
VLAN/bridge forwarding issues
Layer 3 (Network)
Pod CIDR conflicts
Missing routes to pod networks
iptables rules blocking traffic
DNS resolution failures
Layer 4 (Transport)
Service port mismatches
Load balancer health check failures
Connection pool exhaustion
TCP timeout issues
Layer 7 (Application)
HTTP routing rules
TLS certificate problems
API authentication failures
Application-level errors
Building Your OSI Debugging Toolkit
Essential Commands by Layer
Layer 1-2 Debugging:
ip link show                    # Interface status
ethtool eth0                   # Interface details
brctl show                     # Bridge configuration
tcpdump -i eth0                # Packet capture
Layer 3 Debugging:
ip route show                  # Routing table
ping <destination>             # Basic connectivity
traceroute <destination>       # Packet path
iptables -L -n                 # Firewall rules
Layer 4 Debugging:
netstat -tulpn                 # Listening ports
ss -tuln                       # Socket status
telnet <host> <port>           # Port connectivity
lsof -i :<port>                # What's using this port
Layer 7 Debugging:
curl -v http://<host>          # HTTP testing
nslookup <hostname>            # DNS resolution
openssl s_client -connect      # TLS testing
kubectl logs <pod>             # Application logs
The Production Mindset Shift
Old way: "Something is broken, let's try random fixes" OSI way: "Let me systematically isolate which layer has the problem"
Old way: "Network team, fix the network!" OSI way: "We have a Layer 2 bridge forwarding issue between subnets"
Old way: 4 hours of debugging, multiple teams pointing fingers OSI way: 15 minutes to isolate, focused effort to fix
Wrapping Up
The OSI model isn't academic memorization - it's your systematic debugging superpower.
Next time something breaks:
Don't panic and start random troubleshooting
Pick a layer and test it systematically
Move up or down based on what you find
Communicate in terms of layers
Build team knowledge around this framework
Remember: Every production issue exists at a specific OSI layer. Your job is to find which one, not to guess randomly.
Want to go deeper? Paid subscribers get exclusive hands-on guides, complete code examples, and early access to everything I publish. Plus access to my complete cloud-native learning vault.