
Production Case Study: The vLLM Pod That Only OOMed at 3 AM
A 5-week investigation into a memory failure that ignored every rule we knew about LLM inference. The root cause changed how we think about KV cache management.

The Symptom
A multi-tenant LLM inference platform serving roughly a dozen production workloads on H100 nodes. Standard setup: vLLM behind KServe, KServe behind Istio, autoscaling driven by request rate and queue depth.
The platform had been stable for months. Then it started OOMing.
Not constantly. Not predictably. Just sometimes, in the early morning hours UTC, one of the vLLM pods would go OOMKilled. Exit code 137. Always between 2 AM and 4 AM. Never the same pod twice in a row. Service recovered within 60 seconds because the deployment had multiple replicas, but the on-call alert woke up an engineer every time.
For the first week we did what every team does. We assumed it was traffic. We pulled the request rate metrics. The 3 AM window was the lowest-traffic period of the day. Less than 5% of peak QPS.
That was the first signal that this was not a normal OOM.
The Easy Explanations That Were Wrong
A week of investigation eliminated the obvious causes one by one.
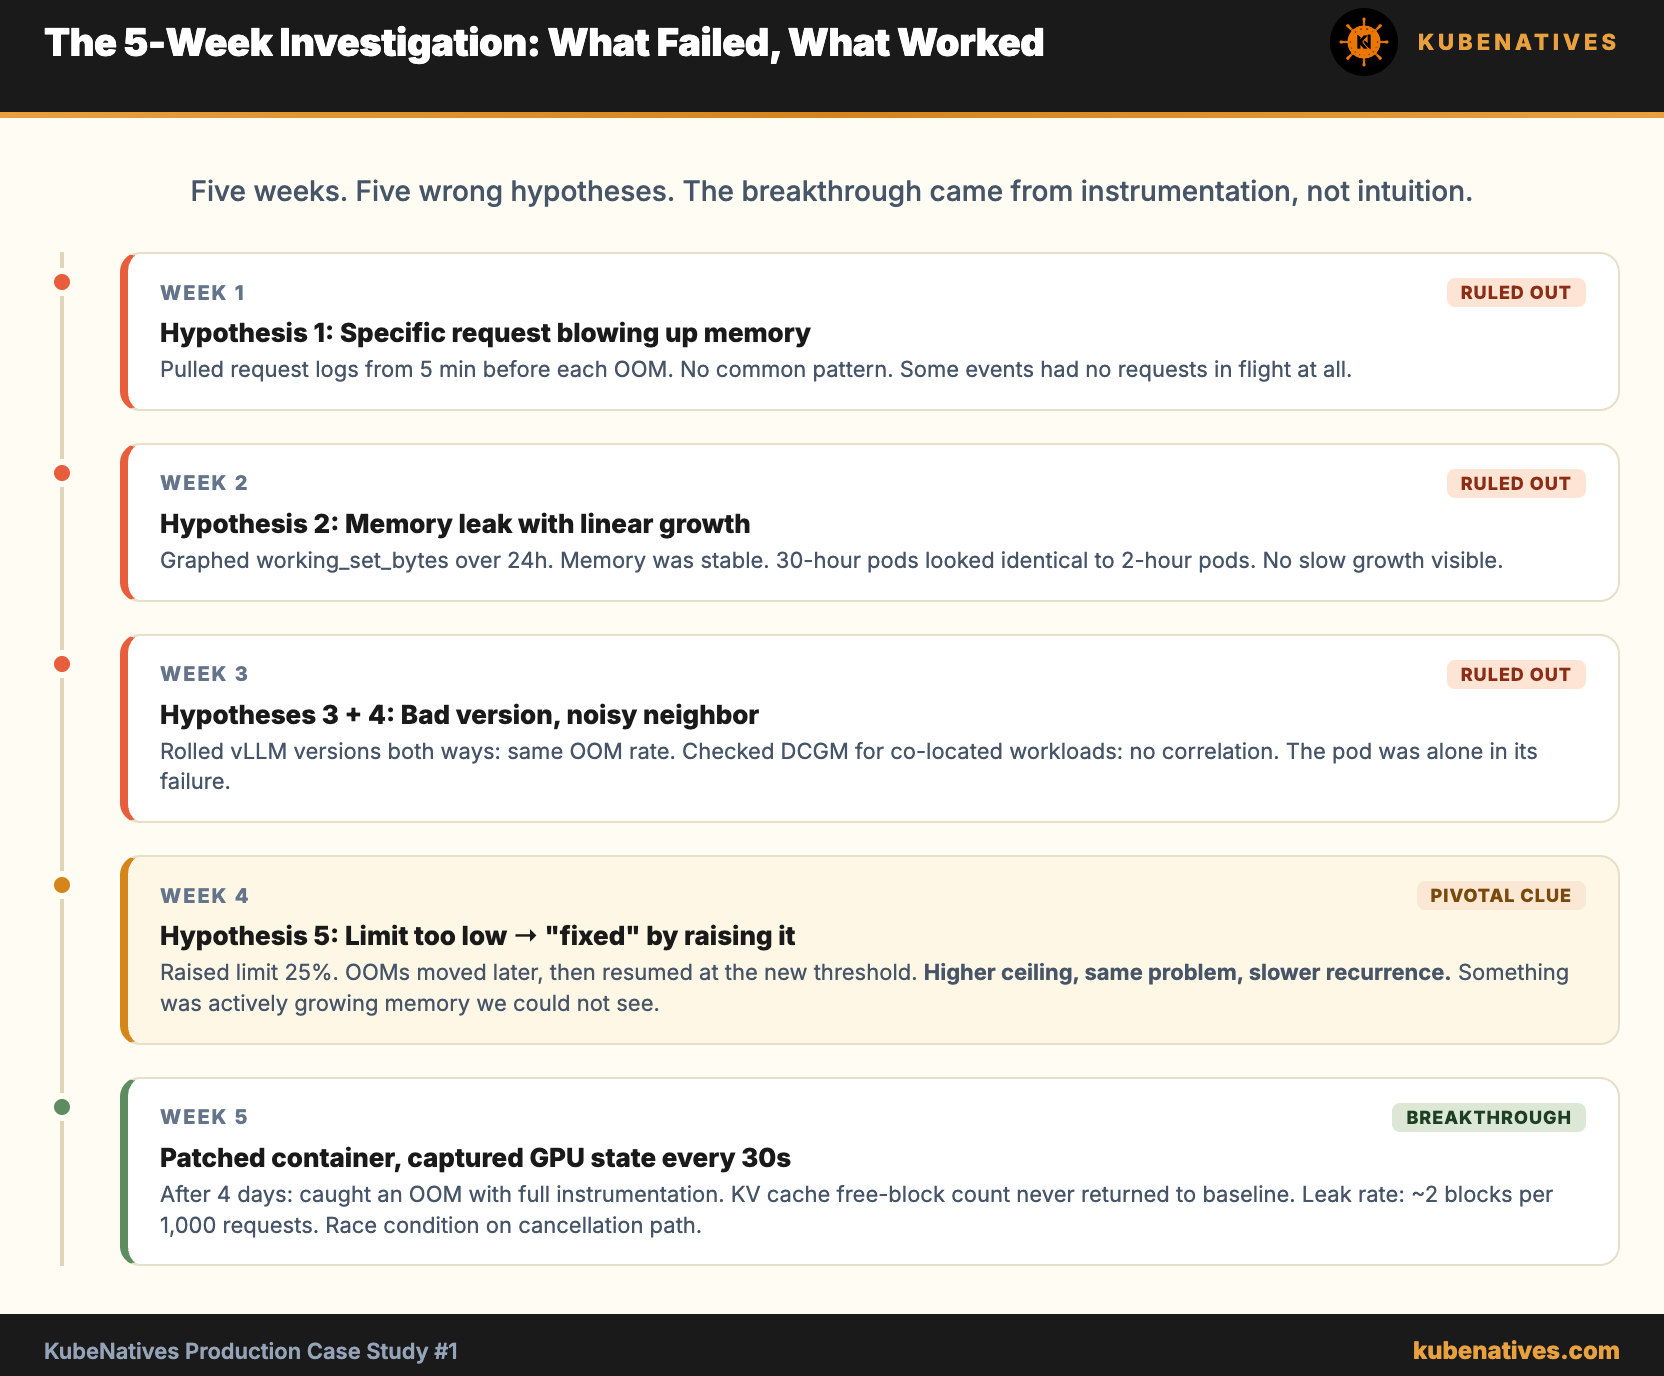
Hypothesis 1: A specific request was blowing up memory.
We grabbed the request logs from the 5 minutes before each OOM event. No common pattern. Different models, different prompt sizes, different output lengths. Some events had no requests in flight at all when the OOM fired. Ruled out.
Hypothesis 2: Memory leak accumulating until breakpoint.
We graphed container_memory_working_set_bytes for each pod over 24 hours. Memory was stable. Pods that had been running for 30 hours had the same memory footprint as pods that had been running for 2. There was no slow growth. The OOM happened from a stable baseline.
Hypothesis 3: Bad model image with a regression.
Rolled back to the previous vLLM version. OOMs continued at the same rate. Rolled forward. Same. The vLLM version was not the variable.
Hypothesis 4: Noisy neighbor on the host.
Checked DCGM metrics for all GPUs on the same physical node during OOM events. No correlated GPU memory pressure or compute contention. The OOMing pod was on a node where every other GPU workload was idle or low utilization.
Hypothesis 5: Resource limit set too low.
This is where most teams stop. They raise the memory limit by 25% and call it solved. We tried it. The OOMs moved later in the night, then resumed at the new threshold a few days later. Higher limit, same problem, slower recurrence.
That last one was the breakthrough, even though we did not know it yet. The fact that raising the limit only delayed the OOM rather than preventing it meant something was actively growing memory. We just could not see what.
