
etcd Debugging Guide: When Your Cluster Starts Losing Its Memory
etcd doesn’t crash loudly. It degrades slowly, then everything breaks at once. Here’s how to catch it before that happens.

Your deployments aren’t rolling out. Pods are stuck in Pending. kubectl get pods takes 8 seconds instead of 1. You check the API server logs and see:
etcdserver: request timed out
This is the moment most engineers realize something they should have known all along: etcd is the most critical component in your Kubernetes cluster, and nobody was watching it.
Every piece of the cluster state lives in etcd. Every pod, every secret, every configmap, every deployment, every service account.
When etcd is slow, the API server is slow. When etcd is down, the cluster is read-only. When etcd loses data, you restore from a backup and hope it’s recent.
This guide covers the five ways etcd breaks in production, the metrics that predict each failure before it happens, and the exact commands to diagnose and fix them.
How etcd Actually Stores Your Cluster
Before debugging etcd, you need to understand what’s inside it.
etcd is a key-value store organized as a flat namespace under /registry. Every Kubernetes resource maps to a key:
/registry/pods/default/nginx-abc123
/registry/deployments/production/api-server
/registry/secrets/kube-system/cluster-admin-token
/registry/configmaps/monitoring/prometheus-config
The value at each key is the full serialized object (protobuf by default, JSON in older clusters). A deployment with 50 replicas doesn’t create 50 keys. It creates one key for the Deployment and 50 keys for the individual Pods.
Every write to etcd creates a new revision. etcd uses Multi-Version Concurrency Control (MVCC), which means it keeps old revisions around until they’re compacted. This is how kubectl --watch works: it reads from a specific revision and streams all changes after it.
The critical implication: etcd’s database grows with every write, even if you’re updating the same key over and over. A deployment that gets updated 1,000 times creates 1,000 revisions of that key. Without compaction, the database grows without bound.
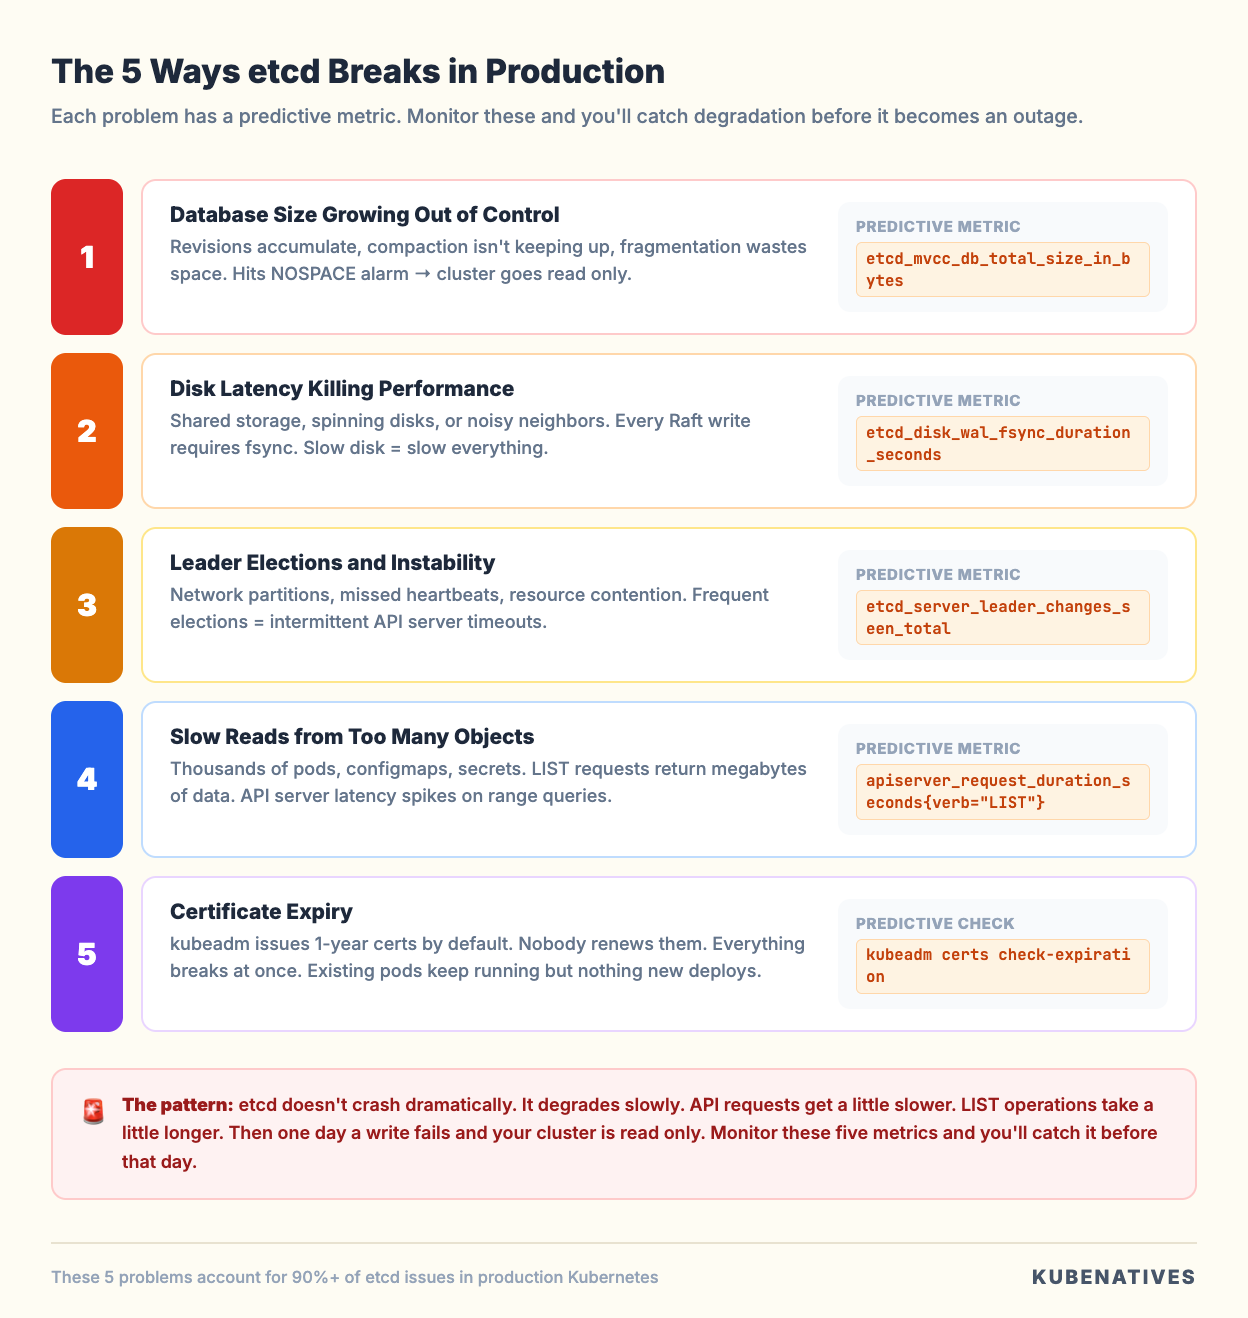
Problem 1: Database Size Growing Out of Control
This is the most common etcd failure in production, and it’s completely preventable.
The symptoms: etcd starts slowly. API server latency creeps up. Eventually, you see the NOSPACE alarm, and writing stops entirely. Your cluster becomes read-only. No new pods, no config changes, no deployments.
Why it happens: etcd’s default storage limit is 2GB (configurable up to 8GB). Every revision takes space. If auto-compaction isn’t configured or isn’t keeping up, the database grows until it hits the limit.
Kubernetes API servers are configured with the default --etcd-compaction-interval=5m, which compacts revisions older than 5 minutes.
But compaction alone doesn’t reclaim disk space. It marks old revisions as free but leaves gaps in the database file. The file doesn’t shrink until you defragment.
The metric that predicts this:
etcd_mvcc_db_total_size_in_bytes
Monitor this. If it’s growing steadily and approaching your --quota-backend-bytes limit, you’re heading for NOSPACE.
Also compare dbSize vs dbSizeInUse:
etcdctl endpoint status --write-out=table \
  --endpoints=https://127.0.0.1:2379 \
  --cacert=/etc/kubernetes/pki/etcd/ca.crt \
  --cert=/etc/kubernetes/pki/etcd/server.crt \
  --key=/etc/kubernetes/pki/etcd/server.key
If DB SIZE is significantly larger than DB SIZE IN USE (more than 50% difference), fragmentation is the problem. Compaction ran, but defragmentation hasn’t.
The fix:
Step 1: Compact old revisions.
# Get the current revision
rev=$(etcdctl endpoint status --write-out=json \
  --endpoints=https://127.0.0.1:2379 \
  --cacert=/etc/kubernetes/pki/etcd/ca.crt \
  --cert=/etc/kubernetes/pki/etcd/server.crt \
  --key=/etc/kubernetes/pki/etcd/server.key \
  | jq -r '.[0].Status.header.revision')

# Compact everything older than current revision
etcdctl compact $rev \
  --endpoints=https://127.0.0.1:2379 \
  --cacert=/etc/kubernetes/pki/etcd/ca.crt \
  --cert=/etc/kubernetes/pki/etcd/server.crt \
  --key=/etc/kubernetes/pki/etcd/server.key
Step 2: Defragment each member (one at a time, not in parallel).
# Defragment a single member
etcdctl defrag \
  --endpoints=https://127.0.0.1:2379 \
  --cacert=/etc/kubernetes/pki/etcd/ca.crt \
  --cert=/etc/kubernetes/pki/etcd/server.crt \
  --key=/etc/kubernetes/pki/etcd/server.key
Important: defragmentation blocks reads and writes on that member. Do it one member at a time, starting with followers, and defragment the leader last to avoid triggering an unnecessary leader election. Wait 30 to 60 seconds between members.
Step 3: If the NOSPACE alarm triggered, disarm it after reclaiming space.
etcdctl alarm disarm \
  --endpoints=https://127.0.0.1:2379 \
  --cacert=/etc/kubernetes/pki/etcd/ca.crt \
  --cert=/etc/kubernetes/pki/etcd/server.crt \
  --key=/etc/kubernetes/pki/etcd/server.key
Prevention: Set up auto-compaction and schedule periodic defragmentation. Most production teams run defragmentation as a weekly CronJob during low traffic windows. The etcd-defrag tool from the etcd community automates the rolling defrag process safely.
Problem 2: Disk Latency Killing Performance
etcd’s performance is directly tied to disk write latency. Every Raft consensus write requires an fsync to the Write Ahead Log (WAL). If that fsync is slow, every API server request that writes to etcd is slow.
The symptoms: API server requests are slow across the board. kubectl apply takes seconds. Controller reconciliation loops are delayed. But etcd isn’t crashing and the database isn’t full.
Why it happens: etcd is running on shared storage, spinning disks, or network attached storage with variable latency. The official recommendation is fsync latency under 10ms. Anything above that and you’ll see degradation. Above 50ms and things start breaking.
The most common version of this: etcd is running on the same nodes as the API server (stacked topology) and sharing the disk with container workloads, logging agents, and monitoring exporters. We covered this tradeoff in detail in our stacked vs external etcd article.
The metric that predicts this:
etcd_disk_wal_fsync_duration_seconds
This is the single most important etcd metric. If the p99 is above 10ms, you have a disk problem. Above 50ms, expect leader elections and cluster instability.
Also watch:
etcd_disk_backend_commit_duration_seconds
This measures how long it takes to commit data to the backend database (boltdb). Healthy clusters show this under 25ms at p99.
The fix:
Short term: Identify what’s competing for disk I/O on the etcd nodes.
# Check disk I/O on etcd nodes
iostat -x 1 5

# Check what processes are doing the most I/O
iotop -o
Long term: Move etcd to dedicated NVMe storage. This is the single biggest performance improvement you can make. When we moved etcd from shared storage to dedicated NVMe in our clusters, API server p99 latency dropped 40%.
If you’re on managed Kubernetes (EKS, GKE, AKS), the cloud provider handles etcd storage. If you’re running self-managed clusters, dedicated SSDs or NVMe for etcd is not optional in production.
Problem 3: Leader Elections and Cluster Instability
etcd uses the Raft consensus protocol. At any given time, one member is the leader and the others are followers. The leader handles all writes and replicates them to followers. If the leader becomes unresponsive, the remaining members elect a new leader.
Occasional leader elections are normal (during upgrades, node maintenance). Frequent leader elections are a sign of trouble.
The symptoms: Intermittent API server timeouts. kubectl commands sometimes work, sometimes hang. Logs show elected leader messages repeatedly.
Why it happens: The most common causes are network partitions between etcd members, disk latency causing the leader to miss heartbeat deadlines, and resource contention (CPU or memory pressure) on etcd nodes.
Raft requires the leader to send heartbeats to followers within a configurable interval (default 100ms). If the leader misses enough heartbeats (default election timeout is 1000ms), followers trigger an election. During the election, the cluster cannot process writes.
The metrics that predict this:
etcd_server_leader_changes_seen_total
More than one leader change per hour indicates instability. More than one per minute is a crisis.
etcd_network_peer_round_trip_time_seconds
This measures the network latency between etcd members. If it’s spiking, network issues are causing the leader to miss heartbeats.
etcd_server_heartbeat_send_failures_total
Rising heartbeat failures mean the leader is having trouble reaching followers.
The fix:
Check the etcd member list and endpoint status to identify which member is the current leader and if any members are unhealthy:
etcdctl member list --write-out=table \
  --endpoints=https://127.0.0.1:2379 \
  --cacert=/etc/kubernetes/pki/etcd/ca.crt \
  --cert=/etc/kubernetes/pki/etcd/server.crt \
  --key=/etc/kubernetes/pki/etcd/server.key

etcdctl endpoint status --write-out=table --cluster \
  --endpoints=https://127.0.0.1:2379 \
  --cacert=/etc/kubernetes/pki/etcd/ca.crt \
  --cert=/etc/kubernetes/pki/etcd/server.crt \
  --key=/etc/kubernetes/pki/etcd/server.key
Look at the RAFT TERM column. If it’s much higher than expected for the cluster’s age, you’ve had many elections.
For network issues between members, check the latency between etcd nodes:
# From each etcd node to the others
ping -c 10 <other-etcd-node-ip>
etcd members should be in the same availability zone or, at a minimum, have sub-millisecond network latency between them. Cross-AZ etcd is technically possible, but adds latency to every write.
Problem 4: Slow Reads from Too Many Objects
As your cluster grows, the number of objects in etcd increases. A cluster with 5,000 pods, 2,000 configmaps, 3,000 secrets, and 500 services has tens of thousands of keys. Listing all pods across all namespaces means etcd reads and returns all of those objects.
The symptoms: kubectl get pods --all-namespaces takes 10+ seconds. Controller managers are slow to reconcile. The API server’s LIST requests show high latency.
Why it happens: The API server translates LIST requests into etcd range queries. A range query on /registry/pods/ returns every pod in the cluster. With thousands of pods, that’s megabytes of serialized data that etcd has to read, the API server has to deserialize, and the network has to transfer.
The metric that predicts this:
apiserver_request_duration_seconds{verb="LIST"}
If LIST operations are significantly slower than GET operations, object count is the issue.
Also check the total key count:
etcdctl endpoint status --write-out=json \
  --endpoints=https://127.0.0.1:2379 \
  --cacert=/etc/kubernetes/pki/etcd/ca.crt \
  --cert=/etc/kubernetes/pki/etcd/server.crt \
  --key=/etc/kubernetes/pki/etcd/server.key \
  | jq '.[0].Status.dbSize'
The fix:
Clean up unused resources. This sounds obvious, but most clusters accumulate orphaned resources over time:
# Find completed jobs older than 24 hours
kubectl get jobs --all-namespaces \
  --field-selector status.successful=1 \
  -o json | jq -r '.items[] | select(.status.completionTime < (now - 86400 | todate)) | .metadata.name'

# Find orphaned replica sets (old rollouts)
kubectl get rs --all-namespaces \
  -o json | jq -r '.items[] | select(.spec.replicas == 0) | "\(.metadata.namespace)/\(.metadata.name)"'

# Find unused configmaps not referenced by any pod
# (This requires more scripting but is worth the effort on large clusters)
Set ttlSecondsAfterFinished on Jobs so completed jobs clean themselves up. Set revisionHistoryLimit on Deployments (default is 10, consider lowering to 3 for large clusters).
For clusters above 5,000 nodes, consider enabling the API server’s watch cache and pagination to reduce the load on etcd from LIST operations.
Problem 5: Certificate Expiry
etcd uses mutual TLS for all communication: between etcd members (peer certificates) and between the API server and etcd (client certificates). When these certificates expire, etcd stops accepting connections. The API server can no longer read or write cluster state.
The symptoms: Everything breaks at once. All kubectl commands fail. The API server logs show TLS handshake failures. Pods stop being scheduled. Existing pods keep running (kubelet works from cache), but nothing new can be created.
Why it happens: kubeadm-provisioned clusters issue certificates with a 1 year expiry by default. If you don’t renew them before they expire, etcd communication fails.
The metric that predicts this:
There’s no etcd metric for certificate expiry. You need to check the certificates directly:
# Check etcd server certificate expiry
openssl x509 -in /etc/kubernetes/pki/etcd/server.crt -noout -enddate

# Check etcd peer certificate expiry
openssl x509 -in /etc/kubernetes/pki/etcd/peer.crt -noout -enddate

# Check etcd CA certificate expiry
openssl x509 -in /etc/kubernetes/pki/etcd/ca.crt -noout -enddate

# Check all K8s certificates at once (kubeadm)
kubeadm certs check-expiration
The fix:
If certificates haven’t expired yet, renew them:
# Renew all certificates (kubeadm)
kubeadm certs renew all

# Restart control plane components to pick up new certs
systemctl restart kubelet
If certificates have already expired, you need to renew them on each control plane node and restart the static pods. This is one of the most stressful operations in Kubernetes because the cluster is essentially down until it’s fixed.
Prevention: Set a monitoring alert for certificate expiry 30 days before they expire. Add this as a Prometheus alerting rule or a simple cron job that checks openssl x509 -enddate weekly.
The etcd Health Check Runbook
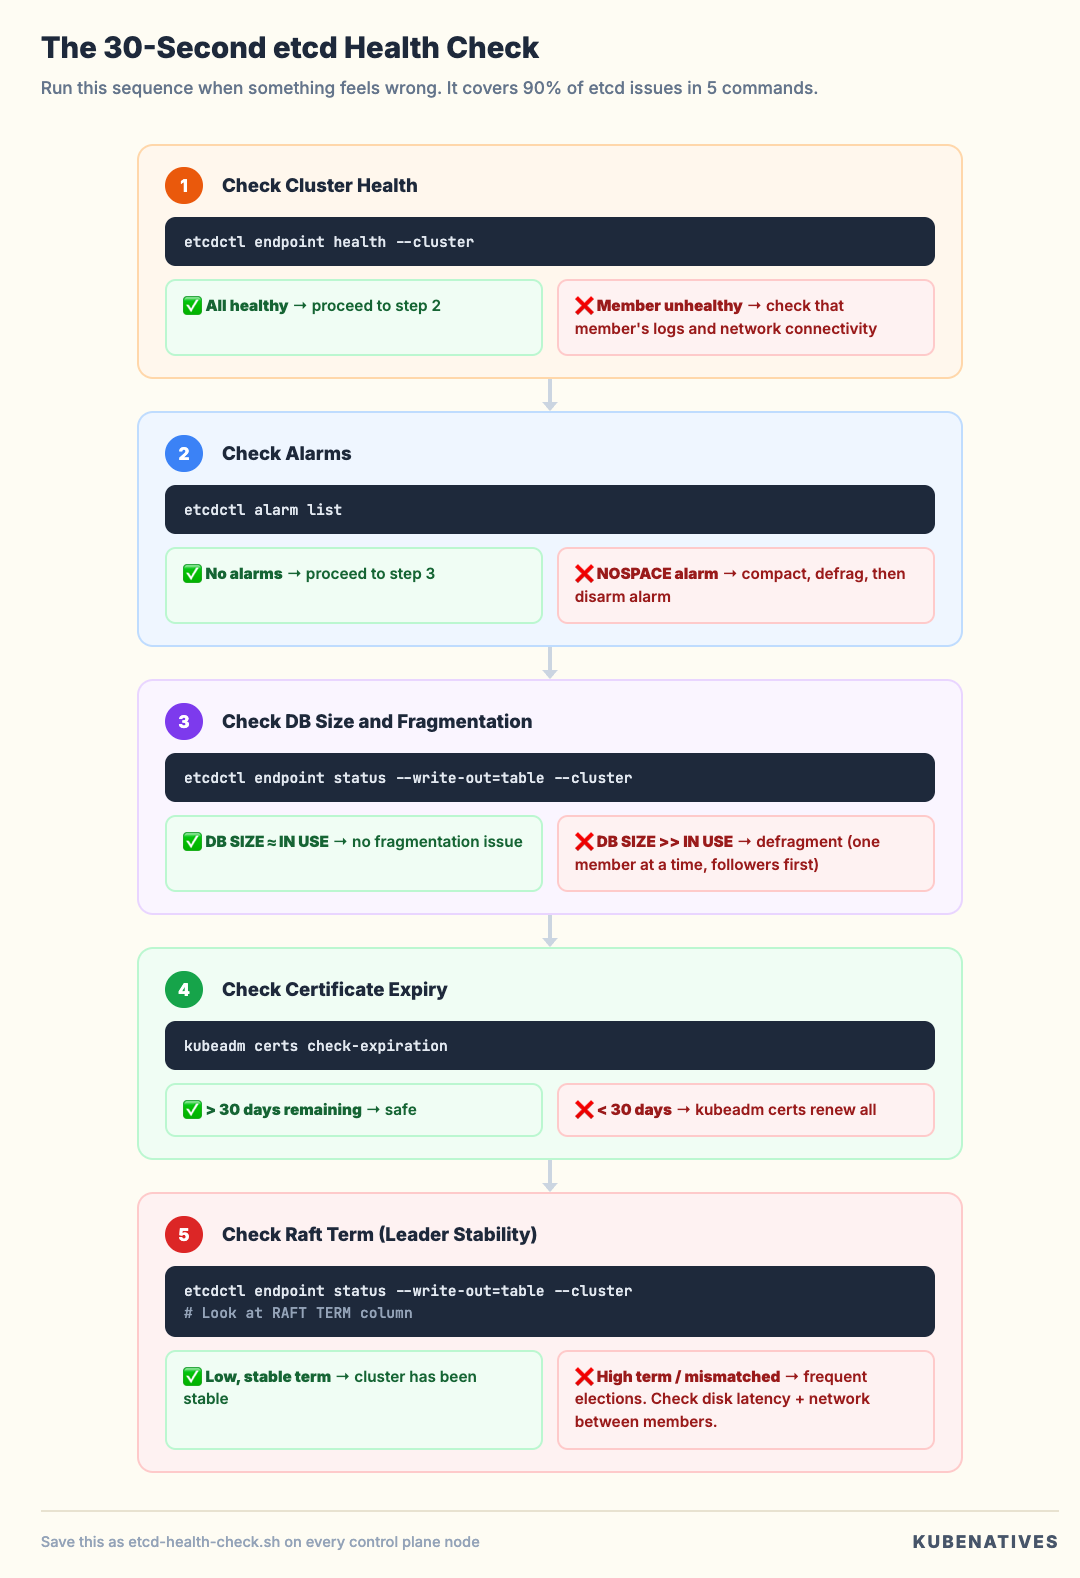
When something feels wrong with the cluster, run this sequence. It covers 90% of etcd issues in under 2 minutes:
#!/bin/bash
# etcd-health-check.sh
# Run this from a control plane node

CERTS="--cacert=/etc/kubernetes/pki/etcd/ca.crt \
       --cert=/etc/kubernetes/pki/etcd/server.crt \
       --key=/etc/kubernetes/pki/etcd/server.key"
EP="--endpoints=https://127.0.0.1:2379"

echo "=== 1. Cluster Health ==="
etcdctl endpoint health --cluster $EP $CERTS

echo ""
echo "=== 2. Member Status ==="
etcdctl endpoint status --write-out=table --cluster $EP $CERTS

echo ""
echo "=== 3. Alarm Status ==="
etcdctl alarm list $EP $CERTS

echo ""
echo "=== 4. Certificate Expiry ==="
echo "Server cert:"
openssl x509 -in /etc/kubernetes/pki/etcd/server.crt -noout -enddate
echo "Peer cert:"
openssl x509 -in /etc/kubernetes/pki/etcd/peer.crt -noout -enddate

echo ""
echo "=== 5. Database Size ==="
etcdctl endpoint status --write-out=json $EP $CERTS \
  | jq '.[0] | {
    dbSize: (.Status.dbSize / 1048576 | floor | tostring + " MB"),
    dbSizeInUse: (.Status.dbSizeInUse / 1048576 | floor | tostring + " MB"),
    fragmentation: (((.Status.dbSize - .Status.dbSizeInUse) / .Status.dbSize * 100) | floor | tostring + "%"),
    leader: .Status.leader,
    raftTerm: .Status.raftTerm
  }'
Save this as etcd-health-check.sh on every control plane node. Run it at the first sign of cluster slowness. Run it weekly as a habit.
The output tells you in 30 seconds whether you have a health problem, size problem, fragmentation problem, certificate problem, or leader stability problem.
The Metrics Dashboard
If you’re running Prometheus, these metrics should be added to your etcd dashboard. Ordered by priority:
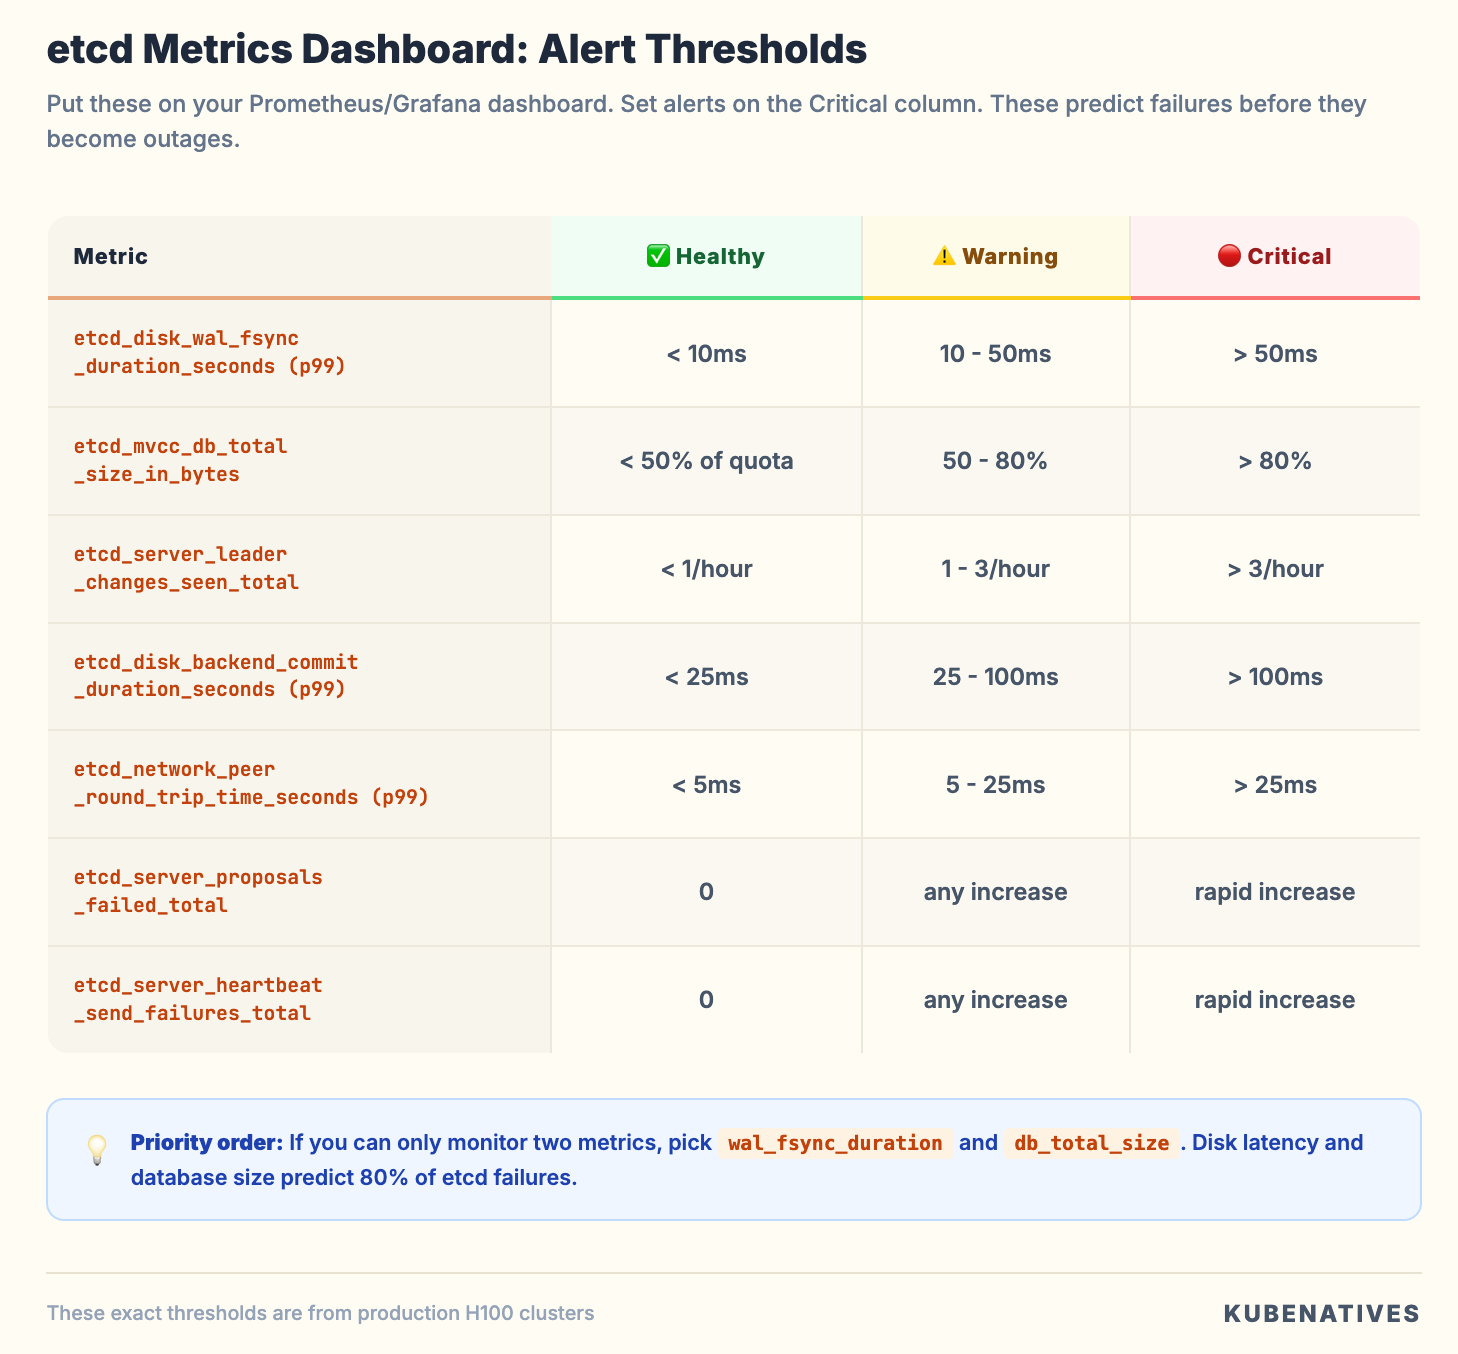
Set alerts on the Critical thresholds. These metrics predict etcd failures before they become outages. We use these exact thresholds in our production H100 clusters, and they’ve caught degrading disks, network issues, and runaway compaction before they impacted workloads.
The Bottom Line
etcd doesn’t crash dramatically. It degrades slowly. API requests get a little slower. LIST operations take a little longer. Disk usage creeps up. Then one day a write fails and your cluster is read-only.
The five problems covered here account for the vast majority of etcd issues in production:
Database size growing out of control → monitor, compact, defragment
Disk latency killing performance → dedicated NVMe, isolate I/O
Leader elections and instability → check network, check disk, check resources
Slow reads from too many objects → clean up, set TTLs, limit revision history
Certificate expiry → monitor, automate renewal, alert 30 days before
The health check runbook takes 30 seconds to run and catches all five. Make it a habit.
Paid subscribers: The complete NOSPACE Emergency Recovery Runbook is live
Next week: MIG vs Time-Slicing vs MPS: Which GPU Sharing Strategy and When.
If you’re running production Kubernetes, I cover control plane operations, GPU infrastructure, and model serving every week.