
How vLLM Serves Models on Kubernetes
PagedAttention, continuous batching, and why your first deployment will probably OOM.

You have GPU nodes running. The NVIDIA GPU Operator is healthy. The device plugin is advertising GPUs. Your cluster is ready.
Now someone asks: “Can we serve Llama 3 on this cluster?”
You search “vLLM Kubernetes deployment.” You find a YAML file. You apply it. The pod goes OOMKilled in 90 seconds.
What just happened?
To fix it you need to understand what vLLM actually does to your GPU. Not from an ML researcher’s perspective. From the perspective of the person who manages the cluster underneath.
What vLLM Actually Is
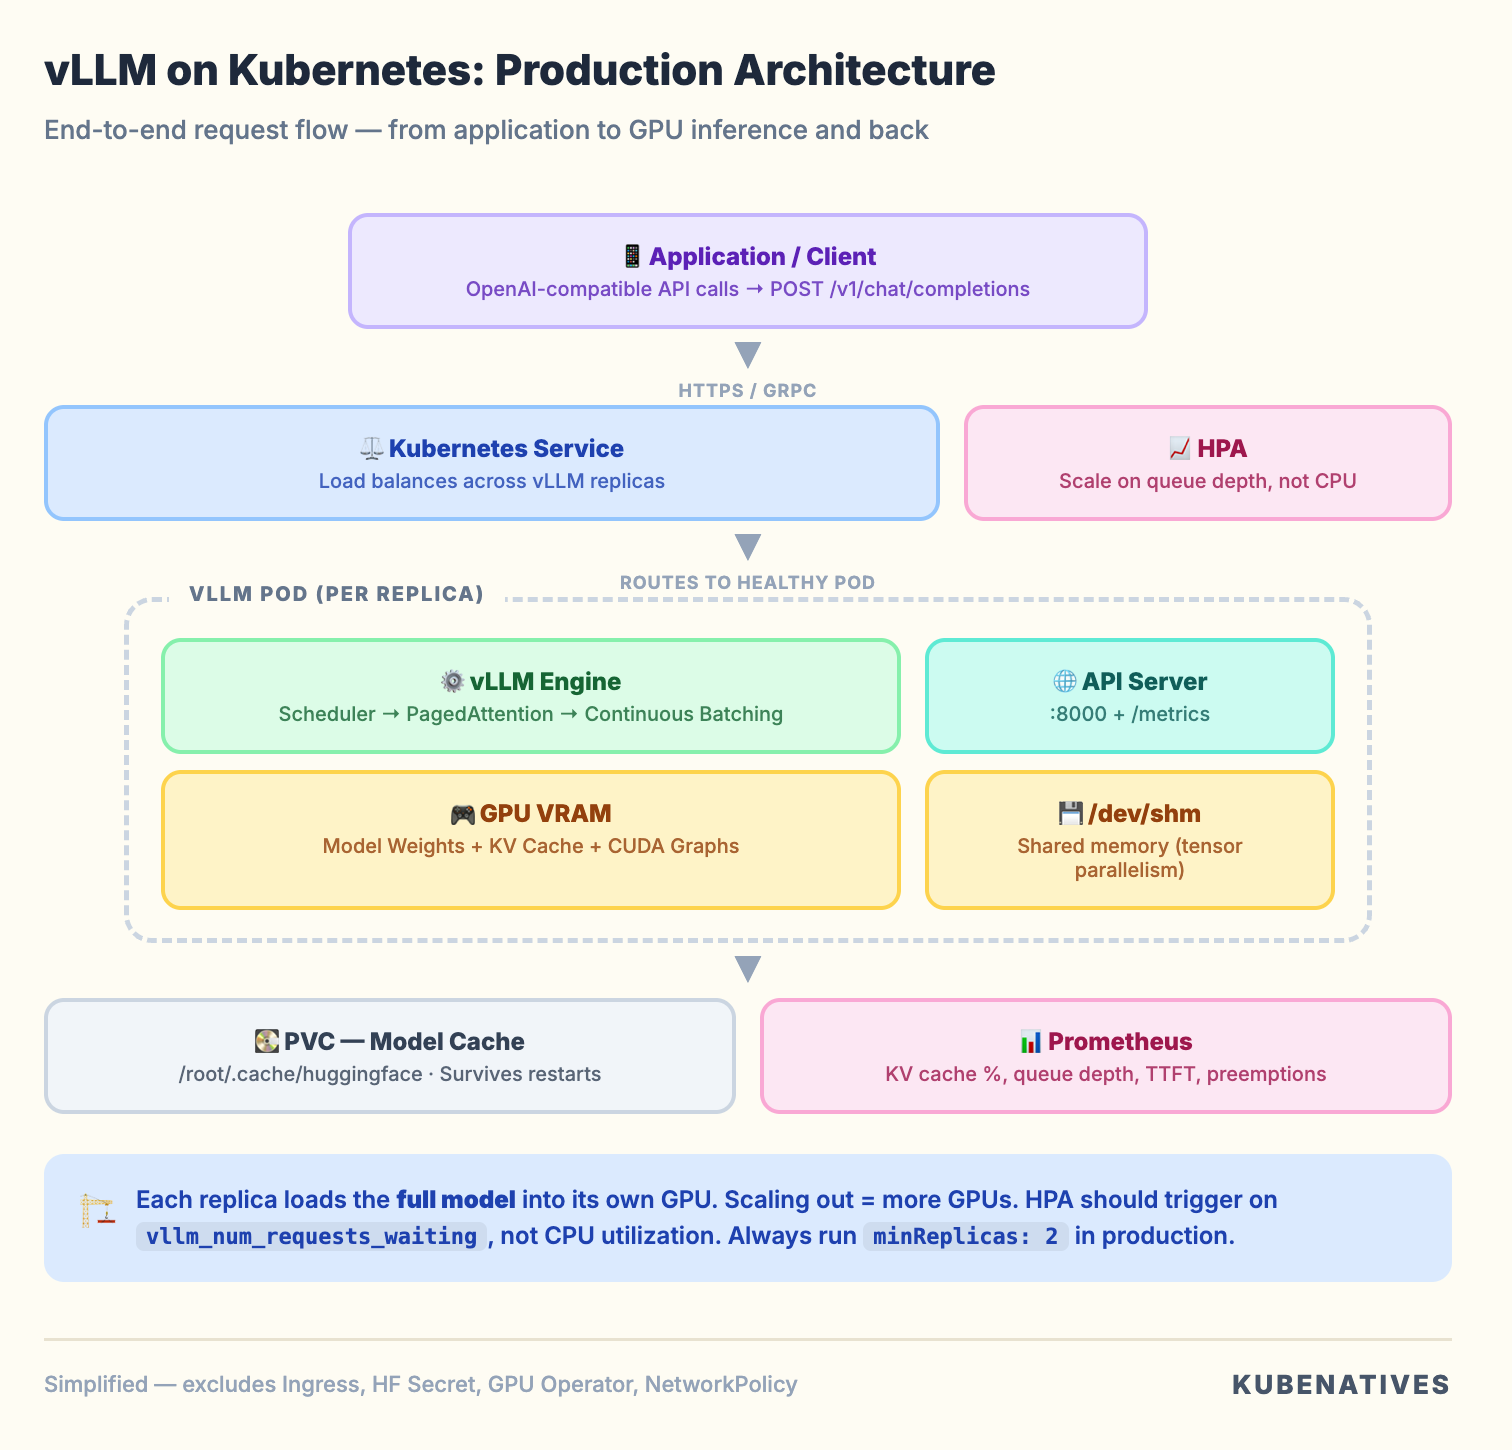
vLLM is an inference serving engine. It takes a model (like Llama 3 70B), loads it into GPU memory, and exposes an OpenAI compatible API that applications can call.
From a Kubernetes perspective, it is a pod that:
Downloads model weights from Hugging Face (or a PVC)
Loads those weights into GPU VRAM
Pre-allocates GPU memory for a KV cache
Starts an HTTP server on port 8000
Accepts inference requests and returns generated text
The pod is stateless (model weights are read only). Compute intensive (GPU bound). Memory hungry (VRAM is the bottleneck). Long running (not a batch job, a persistent service).
The reason vLLM exists instead of teams using the standard Hugging Face pipeline is performance. The standard pipeline wastes 60 to 80% of GPU memory through fragmentation. vLLM eliminates most of that waste. Same hardware, 2 to 24x higher throughput.
Two techniques make this possible: PagedAttention and continuous batching. These are not ML concepts. They are systems engineering concepts borrowed from operating systems.
PagedAttention: Virtual Memory for GPUs
If you have managed Linux systems, you know how virtual memory works. The OS does not give processes contiguous physical RAM. It uses page tables to map virtual addresses to physical pages. Memory is allocated in fixed size blocks (4KB pages). When a process needs more memory, the OS finds a free page anywhere and updates the mapping.
PagedAttention does exactly this for GPU memory.
During inference, every request generates a KV cache. These are key value pairs from the attention mechanism that the model needs to reference when generating each new token.
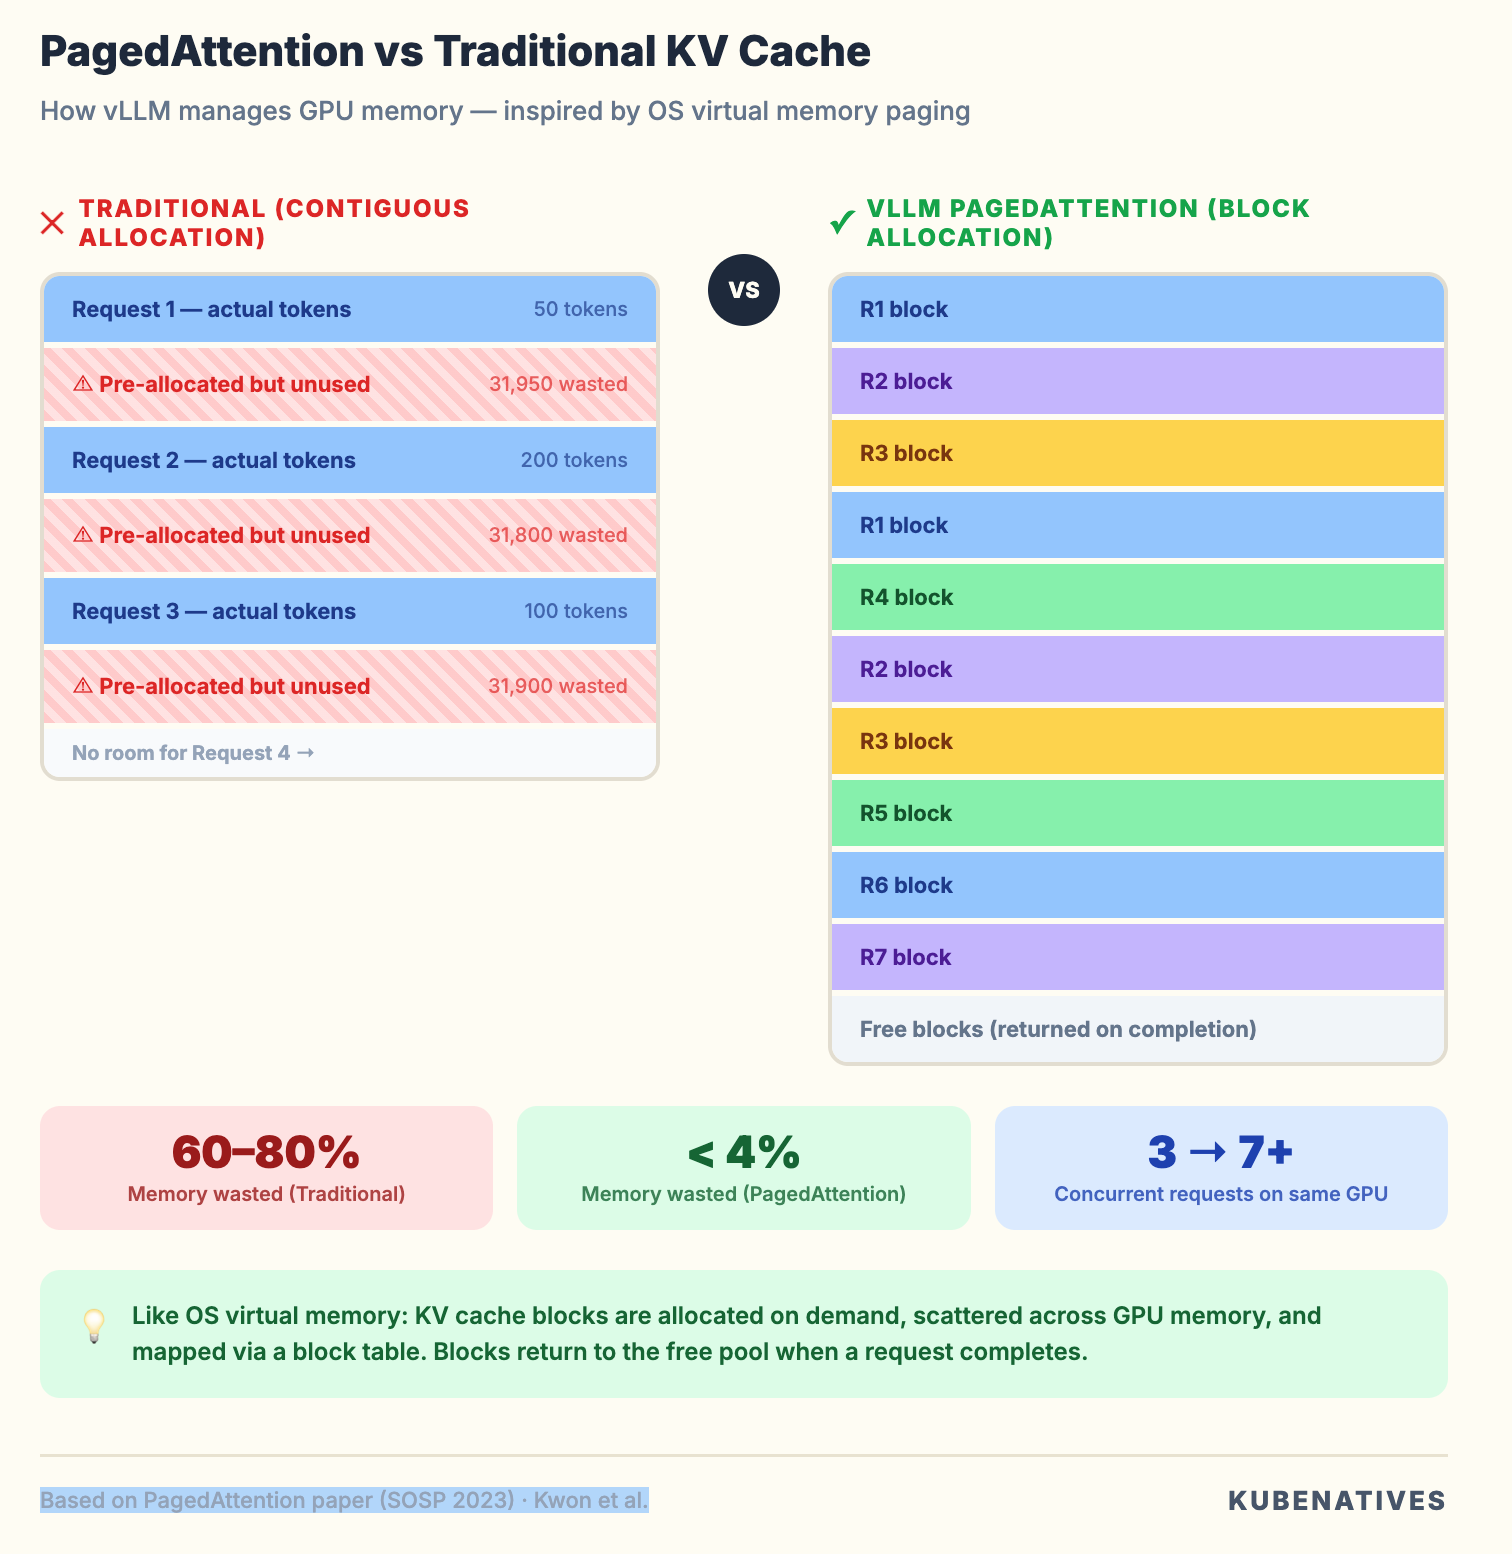
Without PagedAttention, each request gets a pre-allocated contiguous chunk of GPU memory for its KV cache. The problem: you do not know how long the response will be upfront. So you allocate for the maximum possible sequence length.
A model with a 32K context window? That is a 32K token KV cache reservation per request. Even if the response is 50 tokens. Multiply by a batch of 8 requests and you have reserved 256K tokens worth of GPU memory. Using maybe 5% of it.
PagedAttention breaks the KV cache into small blocks (like OS pages). Blocks are allocated on demand as tokens are generated. When a request finishes, its blocks return to the free pool. Different requests’ KV cache blocks can be scattered across GPU memory. The block table handles the mapping.
Why this matters for your infrastructure. PagedAttention is the reason a single A100 80GB can serve a 7B model to 50+ concurrent users instead of 5. It is the difference between needing 10 GPU nodes and needing 2. Your capacity planning changes fundamentally when you understand that vLLM’s memory efficiency is not a nice to have. It is a 10x multiplier on your hardware investment.
Continuous Batching: No More Waiting in Line
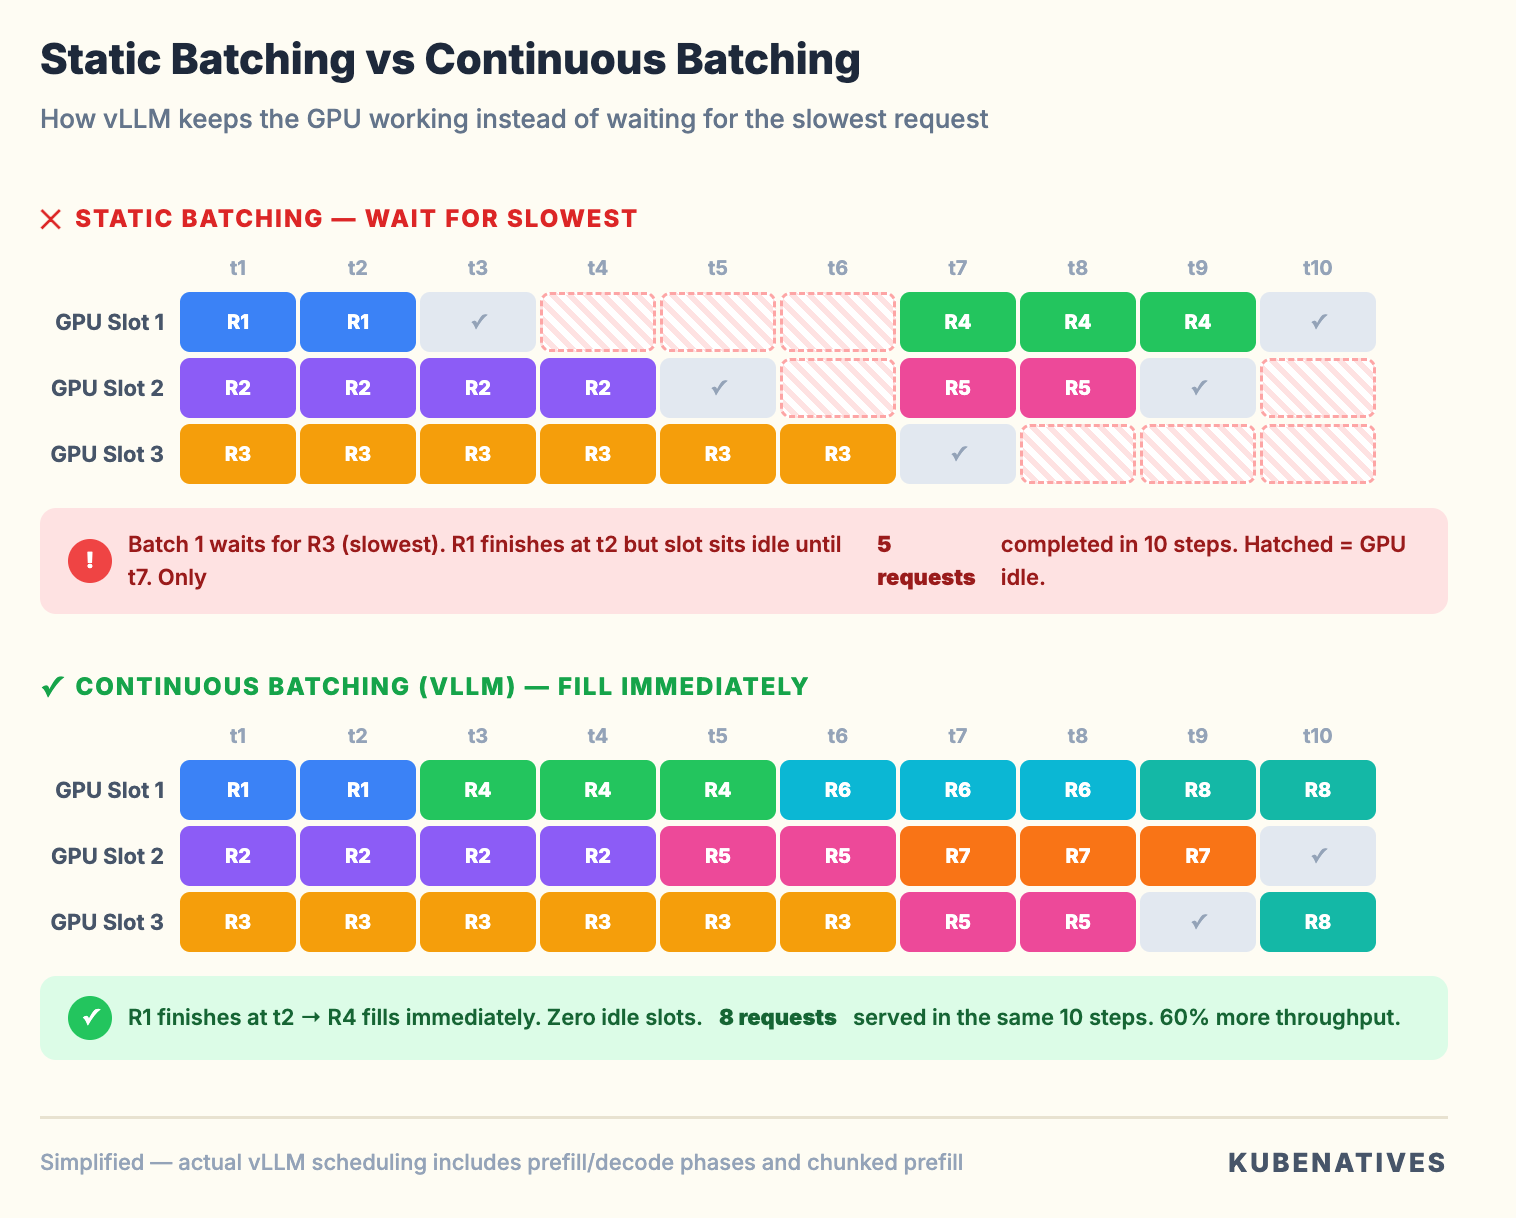
Traditional inference engines use static batching. They collect N requests, process them all together, and wait for the slowest request to finish before accepting new ones.
If request 1 generates 10 tokens and request 2 generates 500, request 1 sits there waiting for request 2 to finish.
vLLM uses continuous batching. The moment a request finishes generating, its slot is immediately filled by the next waiting request. The GPU never idles waiting for a batch to complete.
Think of it like Kubernetes pod scheduling. Static batching is like waiting for an entire ReplicaSet to terminate before scheduling replacements. Continuous batching is like the scheduler filling nodes as pods finish. The cluster never sits idle waiting for stragglers.
The infrastructure impact. Continuous batching means vLLM’s throughput scales with request rate, not batch size. Your horizontal pod autoscaling strategy should be based on queue depth and latency, not request count.
The Kubernetes Deployment: What Actually Happens
Here’s the minimal vLLM deployment that actually works:
apiVersion: apps/v1
kind: Deployment
metadata:
  name: vllm-llama3-8b
  namespace: inference
spec:
  replicas: 1
  selector:
    matchLabels:
      app: vllm-llama3-8b
  template:
    metadata:
      labels:
        app: vllm-llama3-8b
    spec:
      containers:
      - name: vllm
        image: vllm/vllm-openai:latest
        command:
        - python3
        - -m
        - vllm.entrypoints.openai.api_server
        - --model
        - meta-llama/Llama-3.1-8B-Instruct
        - --gpu-memory-utilization
        - "0.85"
        - --max-model-len
        - "4096"
        ports:
        - containerPort: 8000
        resources:
          limits:
            nvidia.com/gpu: "1"
          requests:
            nvidia.com/gpu: "1"
            memory: "24Gi"
            cpu: "4"
        env:
        - name: HUGGING_FACE_HUB_TOKEN
          valueFrom:
            secretKeyRef:
              name: hf-token-secret
              key: token
        volumeMounts:
        - name: model-cache
          mountPath: /root/.cache/huggingface
        livenessProbe:
          httpGet:
            path: /health
            port: 8000
          initialDelaySeconds: 300
          periodSeconds: 10
          failureThreshold: 3
        readinessProbe:
          httpGet:
            path: /health
            port: 8000
          initialDelaySeconds: 300
          periodSeconds: 5
          failureThreshold: 3
      volumes:
      - name: model-cache
        persistentVolumeClaim:
          claimName: vllm-model-cache
---
apiVersion: v1
kind: Service
metadata:
  name: vllm-llama3-8b
  namespace: inference
spec:
  selector:
    app: vllm-llama3-8b
  ports:
  - port: 8000
    targetPort: 8000
  type: ClusterIP
Looks straightforward. But every line has a production implication that most tutorials skip.
Why Your First Deployment OOMs
When vLLM starts, it does three things in sequence:
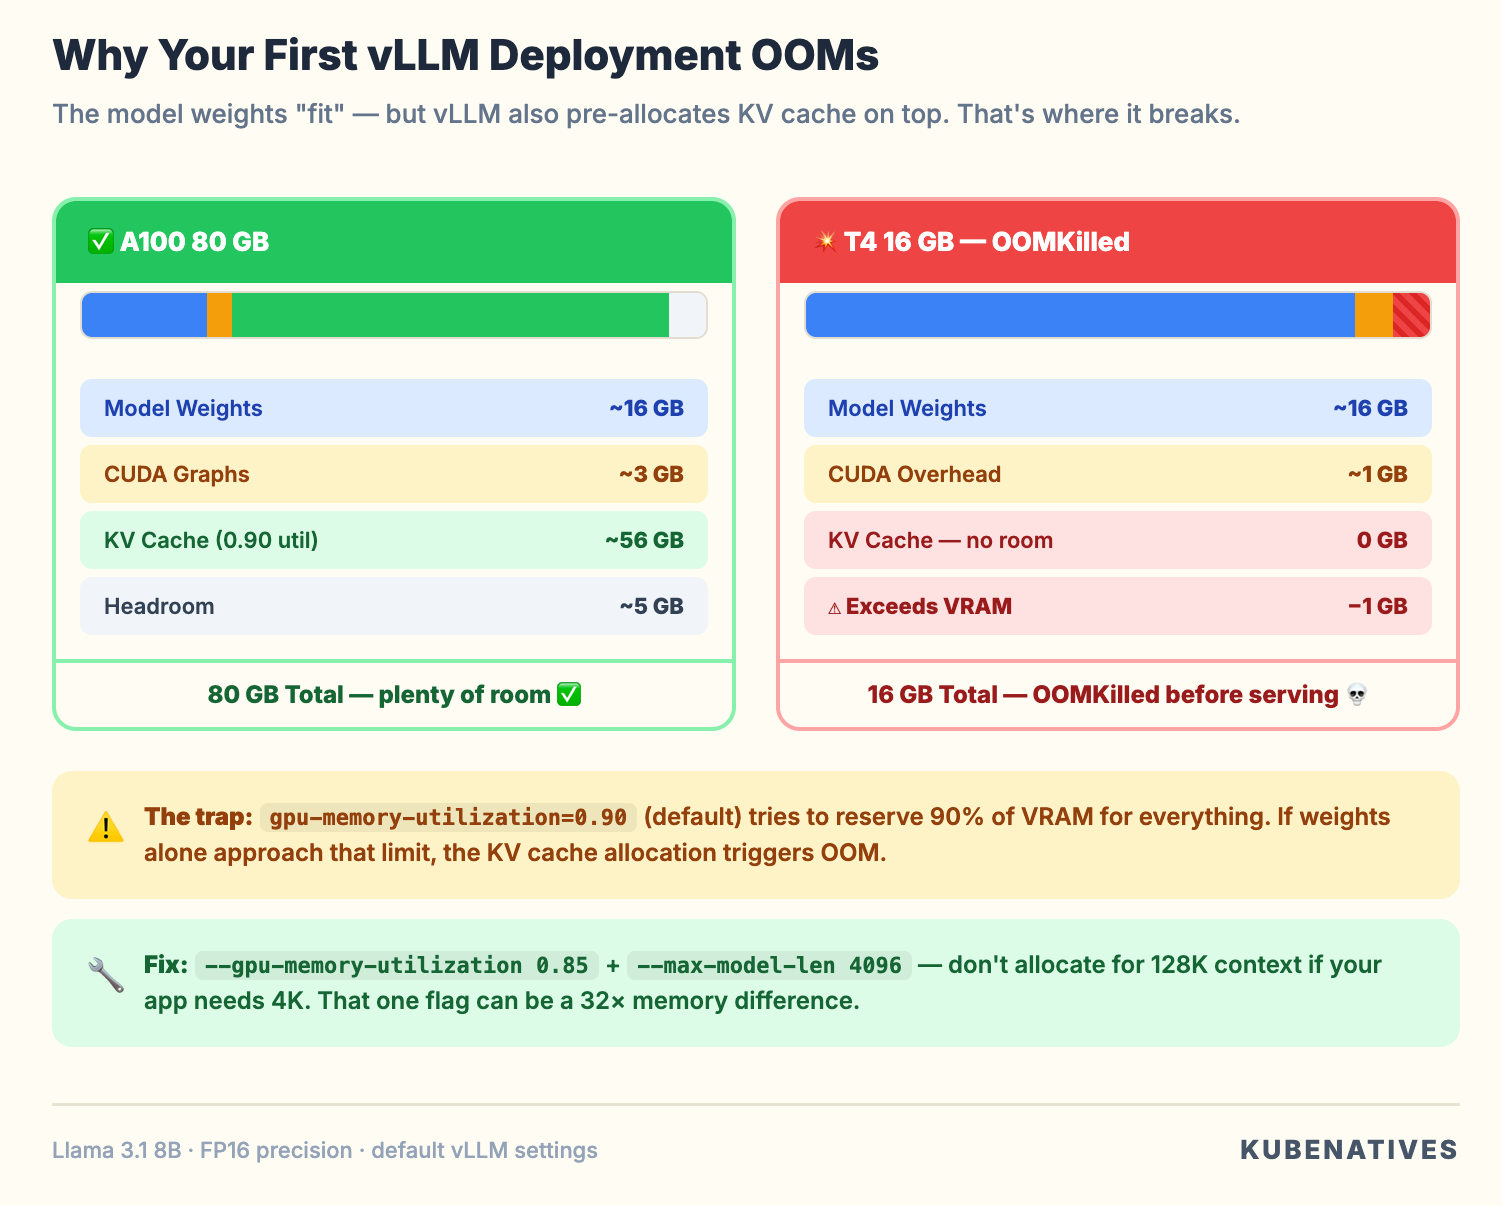
Step 1. Load model weights into GPU memory. For Llama 3.1 8B in FP16, that is roughly 16GB.
Step 2. Pre-allocate KV cache blocks. vLLM grabs as much remaining GPU memory as possible for the KV cache. The gpu-memory-utilization parameter controls this. At 0.90 (the default), it tries to use 90% of total GPU memory.
Step 3. Allocate CUDA graphs. vLLM pre-compiles execution graphs for common batch sizes. This takes additional memory.
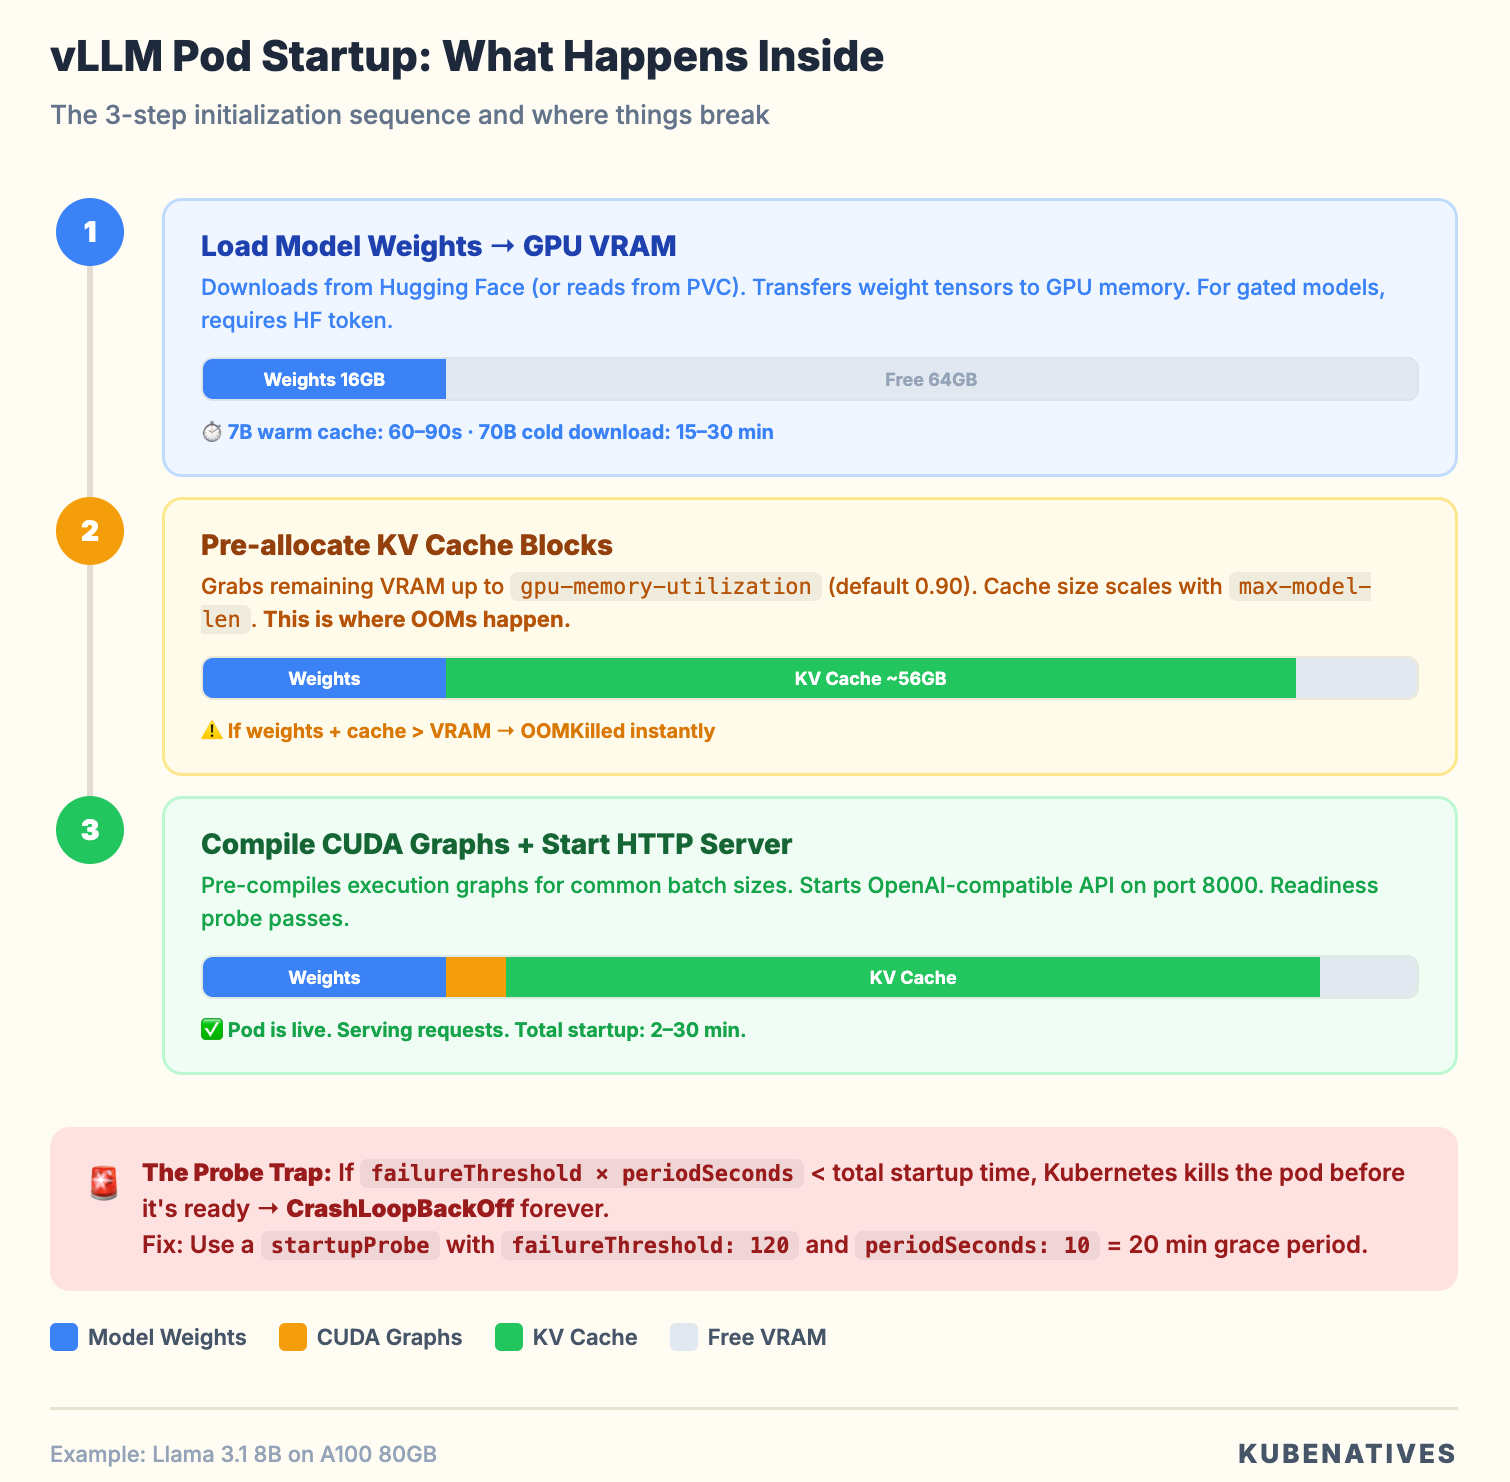
On an A100 80GB:
Model weights: ~16GB
CUDA overhead + graphs: ~2-4GB
Remaining for KV cache at 0.90 utilization: ~56GB
That works fine. But here’s what happens on a T4 16GB:
Model weights: ~16GB
CUDA overhead: ~1GB
Remaining for KV cache: ~-1GB
OOMKilled.
The trap: the model “fits” on the GPU in the sense that the weights load. But vLLM is not just loading weights. It is pre-allocating the KV cache on top of them.
The default gpu-memory-utilization: 0.90 tries to reserve 90% of total VRAM for everything. If the model weights alone take too much, you OOM before serving a single request.
The fix:
--gpu-memory-utilization 0.85    # Leave headroom
--max-model-len 4096             # Don't allocate for 32K context if you don't need it
Lowering max-model-len is the bigger lever. A 32K context model with a 32K KV cache allocation uses 8x more memory than the same model capped at 4096. If your workload only needs 2K to 4K context (which covers most chatbot and API use cases), set it explicitly.
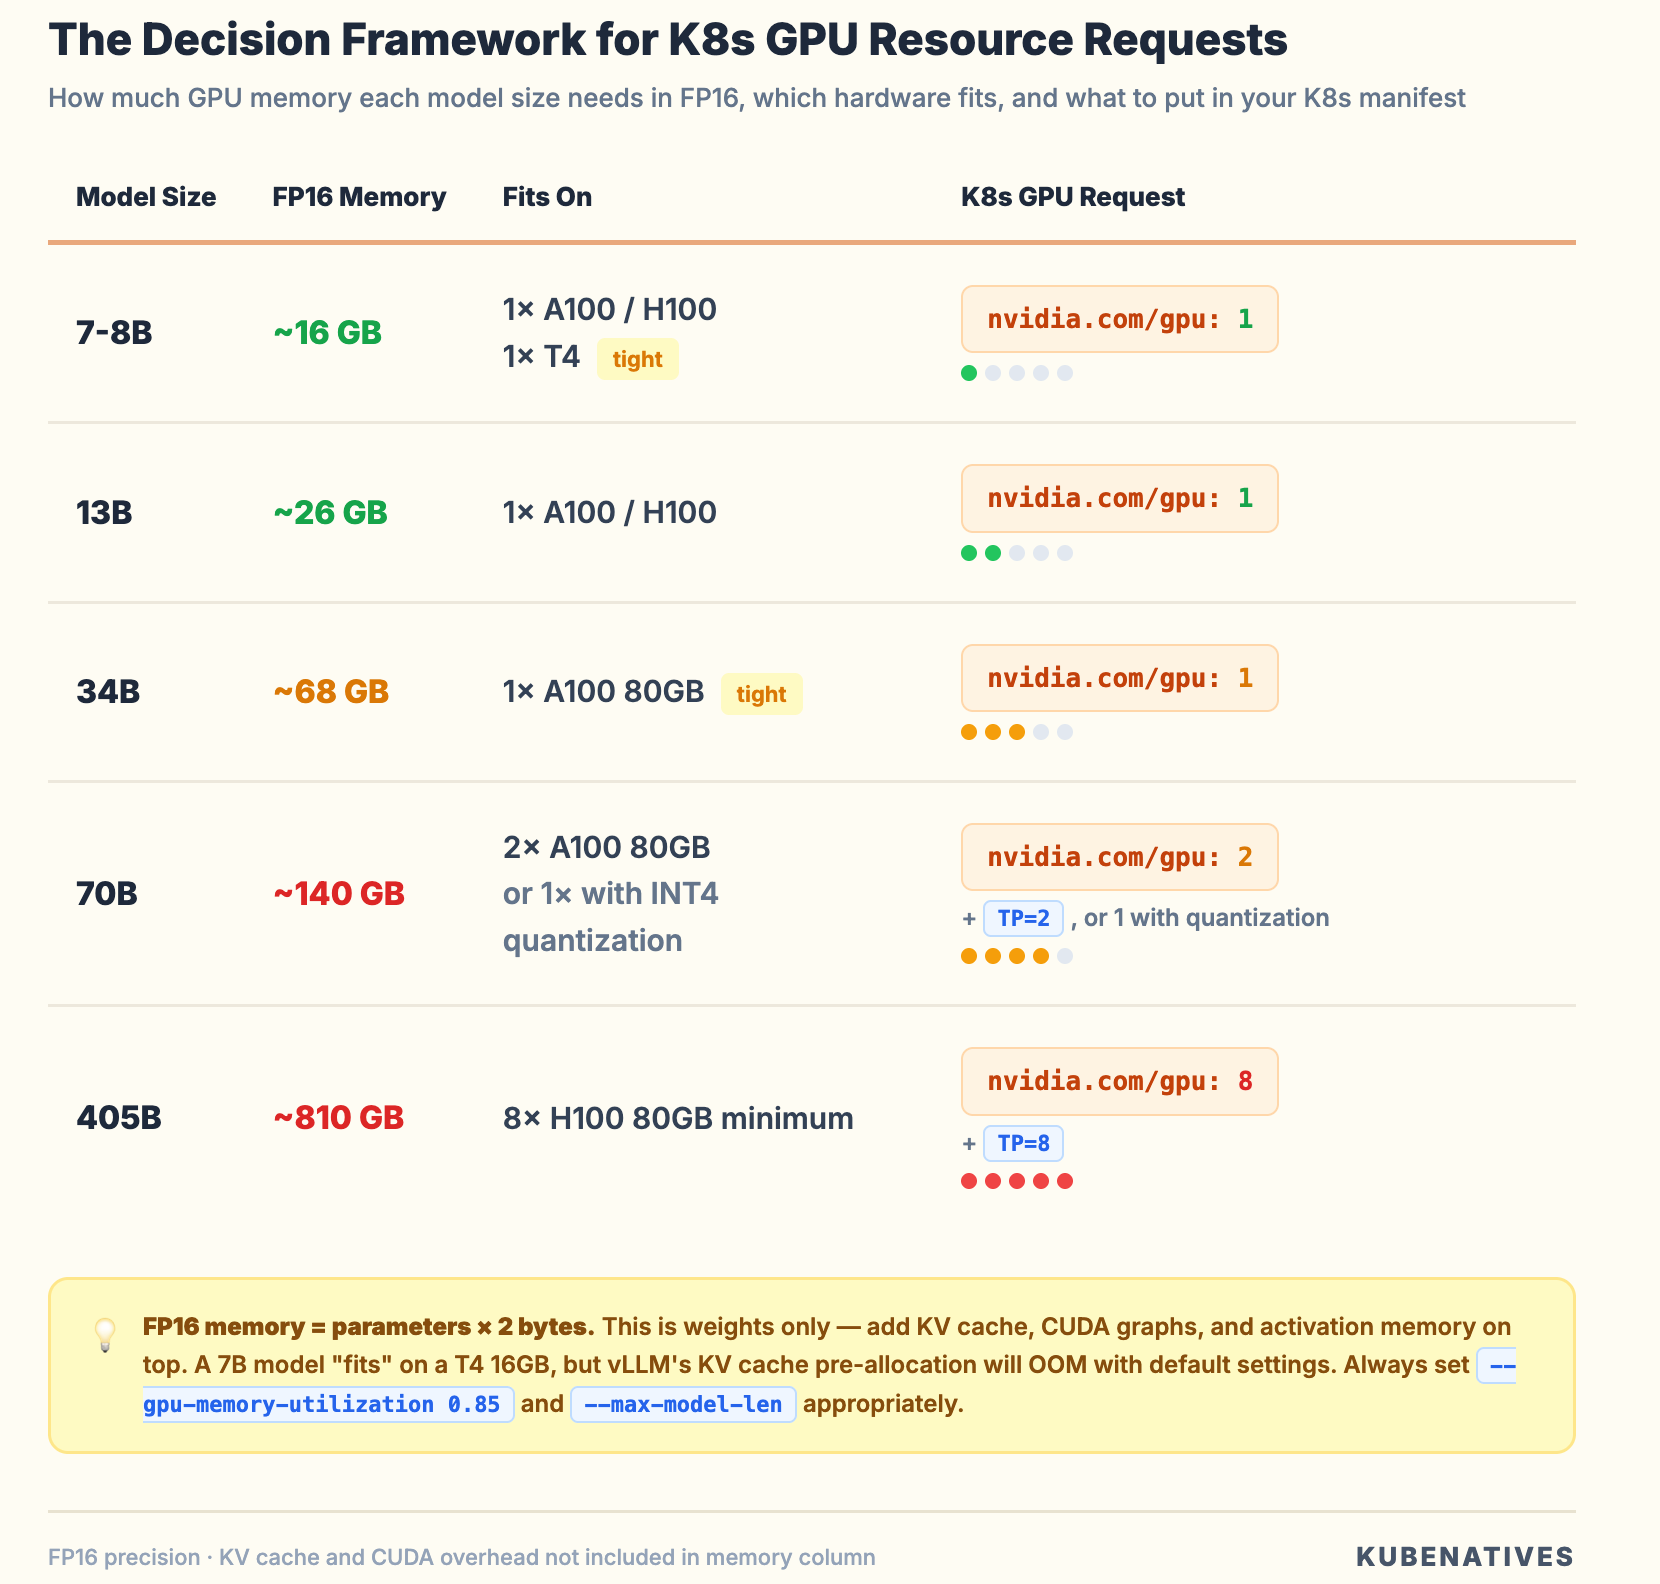
GPU Memory: The Math You Need to Know
Before deploying any model, do this calculation:
Model weight memory = parameters × bytes_per_parameter

FP16:  parameters × 2 bytes
INT8:  parameters × 1 byte
INT4:  parameters × 0.5 bytes
For Llama 3.1 70B in FP16: 70B x 2 = 140GB. That does not fit on a single A100 80GB.
Your options:
Tensor parallelism. Split the model across multiple GPUs. An 8xA100 node can handle it. Set --tensor-parallel-size 8 and request all 8 GPUs in your pod spec. The GPUs must be on the same node. Inter-node tensor parallelism adds too much latency for inference.
Quantization. Reduce the precision. Llama 3.1 70B in INT4 (AWQ or GPTQ) drops to ~35GB. That fits on a single A100 80GB with room for KV cache. Quality impact is minimal for most use cases.
Pipeline parallelism. Split model layers across GPUs. Less communication overhead than tensor parallelism, but adds latency because layers execute sequentially. Better for throughput than latency.
Always add 15 to 20% on top of model weight memory for KV cache and CUDA overhead. If the math is tight, you will OOM under load even if the model loads successfully at idle.
If you’re not sure how K8s GPU scheduling works under the hood,
why nvidia.com/gpu: 1 means a whole physical GPU with no fractional support
I covered that in How Kubernetes Schedules GPUs.
The Probe Problem
You will notice the startupProbe with failureThreshold: 120. That allows 21 minutes for startup.
vLLM startup is slow because it downloads the model (if not cached), loads weights into GPU memory, compiles CUDA graphs for different batch sizes, and runs a profiling pass to determine optimal KV cache allocation.
For a 7B model with a warm cache, startup takes 60 to 120 seconds. For a 70B model downloading from Hugging Face, it can take 15 to 30 minutes.
If your probe window is shorter than the startup time, Kubernetes will kill the pod before it is ready. You will see CrashLoopBackOff with log messages about KeyboardInterrupt: terminated.
Use a startupProbe to give vLLM time to initialize. Then switch to tighter readiness and liveness probes once it is serving. This is cleaner than inflating initialDelaySeconds on liveness probes.
Critical: Always use a PVC for the model cache. Without it, every pod restart re-downloads the model. A 140GB download on every restart is a production incident waiting to happen.
Production recommendations:
startupProbe:
  httpGet:
    path: /health
    port: 8000
  initialDelaySeconds: 60
  periodSeconds: 10
  failureThreshold: 120    # 60 + (10 × 120) = 1260 seconds = 21 minutes
readinessProbe:
  httpGet:
    path: /health
    port: 8000
  periodSeconds: 5
  failureThreshold: 3
livenessProbe:
  httpGet:
    path: /health
    port: 8000
  periodSeconds: 10
  failureThreshold: 6
The /dev/shm Trap
When you enable tensor parallelism (--tensor-parallel-size > 1), vLLM uses shared memory (/dev/shm) for inter-process communication between GPU workers. By default, Docker limits /dev/shm to 64MB.
A 70B model with TP=4 will crash with a cryptic NCCL error because it cannot allocate enough shared memory for tensor transfers.
The fix in your pod spec:
spec:
  containers:
  - name: vllm
    # ...
    volumeMounts:
    - name: dshm
      mountPath: /dev/shm
  volumes:
  - name: dshm
    emptyDir:
      medium: Memory
      sizeLimit: "16Gi"
This mounts a tmpfs at /dev/shm with 16GB. Your container’s memory request should account for this. The shared memory comes from the pod’s memory allocation.
This issue does not show up in dev (single GPU, no TP). It crashes production (multi-GPU, TP enabled). Teams spend hours debugging NCCL errors before realizing it is a 4-line volume mount.
Production Configuration That Matters
These vLLM flags affect your infrastructure:
--gpu-memory-utilization 0.85 Do not use the default 0.90. Leave headroom for CUDA memory fragmentation under load. If running on shared GPUs (MIG or time-slicing), go lower to 0.70 to 0.80.
--max-model-len 4096 Set this to the maximum context length your application actually needs. Not the model’s maximum. This directly controls KV cache allocation.
--max-num-seqs 256 Limits concurrent requests in a batch. Lower this if you see preemption warnings. Preemption means vLLM is evicting KV cache from active requests to make room for new ones. It hurts latency badly.
--enforce-eager Disables CUDA graph compilation. Uses more memory per forward pass but eliminates the upfront compilation time. Use when GPU memory is extremely tight.
--disable-log-requests In production, disable request payload logging to avoid filling log storage. Keep --log-stats enabled for monitoring.
Monitoring: What to Watch
vLLM exposes Prometheus metrics at /metrics. The ones that matter:
vllm:num_requests_running Active requests in the batch. If this consistently equals max-num-seqs, you are saturated. Scale out.
vllm:num_requests_waiting Queued requests. If this is growing, you need more replicas. This is your HPA signal.
vllm:gpu_cache_usage_perc KV cache utilization. Above 90% means you are close to preemption. Above 95% means you need to reduce max-num-seqs or add more GPU memory.
vllm:num_preemption_total If this counter is incrementing, vLLM is evicting active requests. Each preemption means a request gets recomputed from scratch. This tells you that you have over-committed your GPU memory.
vllm:time_to_first_token_seconds TTFT measures how long users wait before seeing the first token. If it is degrading, prefill is getting queued behind decoding work.
vllm:inter_token_latency_seconds Time between successive tokens. This affects the “streaming” feel. If it is high, your GPU is compute bound during decoding.
A minimal Prometheus scrape config:
- job_name: 'vllm'
  kubernetes_sd_configs:
  - role: pod
  relabel_configs:
  - source_labels: [__meta_kubernetes_pod_label_app]
    regex: vllm-.*
    action: keep
  - source_labels: [__meta_kubernetes_pod_annotation_prometheus_io_port]
    target_label: __address__
    regex: (.+)
    replacement: ${1}:8000
  metrics_path: /metrics
Scaling: When and How to Add Replicas
vLLM pods do not scale like web servers. Adding replicas means loading the entire model into a new GPU. That is 16 to 140GB of VRAM per replica.
When to scale out (more replicas). num_requests_waiting > 0 consistently. TTFT exceeds your SLA. You need redundancy (single replica means single point of failure).
When to scale up (bigger GPU or more GPUs per pod). Model does not fit on current GPU. KV cache preemption is happening frequently. You need longer context lengths.
HPA configuration for vLLM:
apiVersion: autoscaling/v2
kind: HorizontalPodAutoscaler
metadata:
  name: vllm-hpa
spec:
  scaleTargetRef:
    apiVersion: apps/v1
    kind: Deployment
    name: vllm-llama3-8b
  minReplicas: 2
  maxReplicas: 8
  metrics:
  - type: Pods
    pods:
      metric:
        name: vllm_num_requests_waiting
      target:
        type: AverageValue
        averageValue: "5"
  behavior:
    scaleDown:
      stabilizationWindowSeconds: 600   # Wait 10 min before scaling down
      policies:
      - type: Pods
        value: 1
        periodSeconds: 300              # Remove 1 pod per 5 min max
    scaleUp:
      policies:
      - type: Pods
        value: 2
        periodSeconds: 60              # Add up to 2 pods per minute
The HPA talks to the API server, which talks to etcd — if you're curious how that chain actually works and what breaks at scale, I wrote about what happens inside the K8s control plane.
The asymmetric scaling behavior matters. Scale up aggressively (traffic spikes are real). Scale down slowly. Each new vLLM pod takes minutes to start. If you scale down too fast and traffic returns, users wait for model loads.
Set minReplicas: 2 for any production workload. A single vLLM replica with a 5 minute startup time means a 5 minute outage on any pod failure.
vLLM Production Stack: The K8s-Native Option
For teams ready to go beyond a single deployment, the vLLM project now offers a production stack, a Helm chart that deploys vLLM with request routing, observability, and multi-backend support.
helm install vllm-stack vllm/vllm-stack \
  --set model.name=meta-llama/Llama-3.1-8B-Instruct \
  --set replicaCount=3 \
  --set router.enabled=true \
  --set observability.prometheus=true
The production stack adds a request router that directs requests to specific backends based on routing keys or session IDs.
The key benefit is that it maximizes KV cache reuse across requests. If two requests share the same system prompt (which is common, most applications use identical system prompts for all users), the router sends them to the same backend, so the prefix KV cache is already warm.
This is an infrastructure optimization, not an ML one. The router doesn’t know anything about the model. It’s optimizing cache hit rates at the scheduling layer.
When to Use vLLM vs. Alternatives
The question isn’t always “should I use vLLM?” Sometimes the answer is Triton, KServe, or something else entirely.
Use vLLM when:
You’re serving LLMs specifically (not vision models, not speech models)
You want maximum throughput for text generation
Your team is comfortable with a single-purpose inference engine
You need an OpenAI-compatible API (drop-in replacement for application code)
Consider Triton Inference Server when:
You’re serving multiple model types (ONNX, TensorRT, PyTorch)
You need NVIDIA’s full optimization stack (TensorRT-LLM)
You’re running a mix of LLMs and traditional ML models on the same cluster
Layer KServe on top when:
You need Kubernetes-native canary deployments between model versions
You need traffic splitting (10% to new model, 90% to old)
You want autoscaling integrated with Knative
You need a standardized inference protocol across multiple serving engines
The pattern I recommend for most teams: Start with vLLM as the serving engine. Add KServe when you need traffic management and multi-model orchestration. Don’t start with all three — pick one, get it running, then layer on complexity when you actually need it.
Common Failure Patterns
After running model serving on H100 clusters, these patterns come up most:
Pattern 1: Pod starts, loads model, OOMs. Almost always gpu-memory-utilization too high or max-model-len too large. Do the math before deploying.
Pattern 2: Pod passes readiness probe, then OOMKilled under load. Model fits at idle. But KV cache allocation under concurrent requests exceeds VRAM. Lower max-num-seqs or increase headroom.
Pattern 3: Model downloads on every restart. No PVC for the model cache. Add a ReadWriteOnce PVC mounted at /root/.cache/huggingface. Size it at 2x the model file size.
Pattern 4: TTFT spikes periodically. Preemption is happening. Check vllm:num_preemption_total. Reduce concurrent request limit or add more GPU memory.
Pattern 5: Tensor parallelism crashes with NCCL errors. Missing /dev/shm volume mount. Add the emptyDir tmpfs.
Pattern 6: Pod stuck in ContainerCreating for 10+ minutes. Model PVC is ReadWriteOnce and already mounted on another pod. You cannot share a RWO PVC across replicas. Use ReadWriteMany or use a shared model store with each pod having its own cache.
The Bottom Line
vLLM is the best inference engine for LLM serving on Kubernetes right now. PagedAttention and continuous batching are genuine systems engineering innovations that eliminate GPU memory waste.
But deploying it on Kubernetes requires understanding that this is not a typical web application. It is a GPU bound, memory hungry, slow starting service.
Get the infrastructure right. Proper memory math. Generous probes. PVC backed model caches. Shared memory for tensor parallelism. Monitoring that tracks KV cache utilization rather than CPU.
A single GPU serves 10x what a naive deployment can. Get the infrastructure wrong and you burn $30K per month on OOMKilled pods.
The GPU is expensive. vLLM makes sure you actually use it.
Paid subscribers:
The complete vLLM production deployment template (8 YAML files with HPA, monitoring, and PDB) is live → Access here
Next week: Dynamic Resource Allocation — the Kubernetes feature that changes GPU scheduling from static allocation to on-demand.
If you’re building inference infrastructure on Kubernetes, I cover this intersection every week. Subscribe at kubenatives.com.